20 Years of Charting Excellence
The Preferred Charting Library for JavaScript Pros Turns 20!
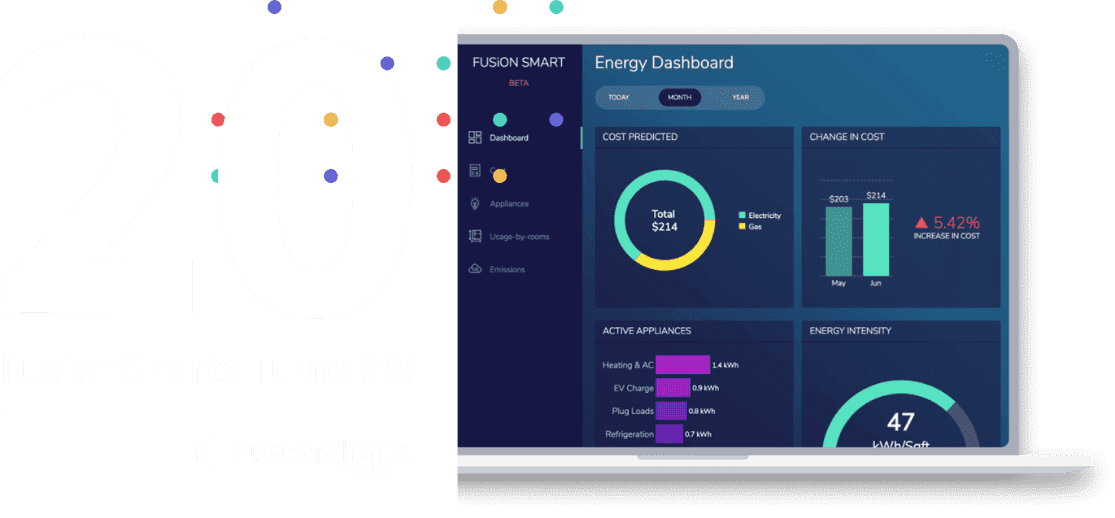
Whether you are building a dashboard for desktop or mobile, with simple or complex data, FusionCharts has you covered
100+ Interactive Charts & 2,000+ Data-driven Maps
Get all the variations of popular charts like Bar, Column, Line, Area, and Pie; or domain-specific charts like Treemaps, Heatmaps, Gantt Charts, Marimekko Charts, Gauges, Spider Charts, Waterfall Charts, and many more! In addition to charts, we also have over 2000+ choropleth maps which cover countries, counties and even cities!
- Column Chart
- Sankey
- Chord
- World Map with Drilldown
- Angular / Dial Chart
- Radar / Spider Chart
- Box & Whisker Chart
High-performance time-series charts for ‘big data’ dashboards
Want to visualize data every millisecond for your financial application? Or visualize thousands of sensor data for your IoT application? The time-series chart has it all covered. Render thousands or even a million data points in the browser.
- Time-series with Line
- Time-series with Columns
- Multivariate Chart
- Stock Chart
- Time-series Chart with Annotations
Why should you choose FusionCharts products?
There are over 800,000 developers from 28,000+ companies prefer FusionCharts products over Open source or other paid libraries. Here are a few reasons:
- 15 minutes to first chart, without any learning curve. Plus, consistent API across different charts make it simple to build complex charts or dashboards.
- Consistent look & feel. Our themes have a consistent look across products. Did we tell you that you can also build your own theme?
- Various installation options available (direct JavaScript, CDN, NPM) and pre-integrated with all popular JavaScript libraries and back-end programming languages
- Comprehensive documentation for each library or programming language, with a lot of live-examples.
- Ready-to-use chart examples, industry-specific dashboards and even data stories, available with source code for you to quickly get started.
FusionCharts leads the way in building beautiful dashboards
Loved by over 800,000 developers and 28,000 organizations across the globe
Love from Our Customers
Thank you for all your help!! This is what I call GREAT customer service. I am very glad Dell decided to purchase this product as your help has made it worth every penny.
Ryan Jeffords,
This is a great application, it saves a lot of time and although I would like to say the 'Wow' factor is because of the great data I provide; I know that it is more likely due to the presentation that FusionCharts has made possible.
Jonathan Rickard,
Best money I have ever spent on a useful piece of application software. Ideal for the management reporting that Electric Penguin delivers to its clients.
Paul Smith,
FusionCharts and [Fusion]Maps offered us a clean and dynamic way of displaying information on our site. We used a combination of drill-down maps and charts to create a very interactive model of Native American Service Centers across the US. We could not have done it without Fusion components.
Cherylyn Stoltman,