I recently came across an article on
TheNextWeb about the research lab, SRI (Stanford Research Institute), which brought us the widely acclaimed Siri on Apple’s iOS, invented HDTV, the computer mouse, and was part of the world’s first electronic computer network that later came to be known as the internet. The image in the post caught my attention immediately, as it displays charts and maps from
FusionCharts Suite XT in all their glory. I couldn’t resist clicking through and watching the videos of what SRI does, and at the end of it was inspired to get a glimpses how technology is going to shape the future, and more selfishly, that FusionCharts products are playing a subtle, yet important role in making it happen.
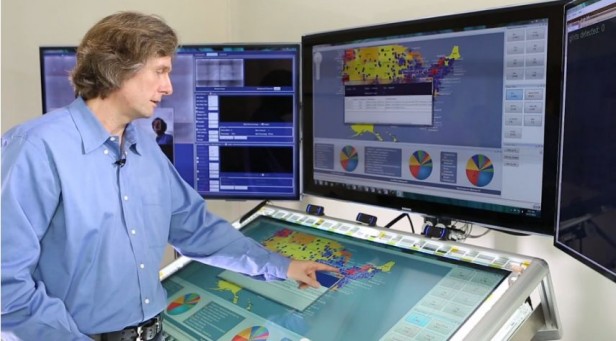
There are a couple of videos in the article, but most interesting one of the lot is the one where computer scientist, Rukman, talks about SRI’s work on bRight (pronounced ‘bright’ not ‘b right’), a workstation of the future, or as Rukman puts it bluntly ‘think of it as a giant iPad’. It’s a monstrous machine with 3 face recognition cameras, 2 cameras exclusively for gaze tracking, 16 infra red detectors, proximity sensors, and loads of other tracking devices that take user interaction to a whole new level.
The What:
In Rukman’s words, bRight aims to solve the problem of ‘cognitive overload’. To break it down, it addresses the problems of an overwhelming amount of information, the need to make fast decisions, and the need to collaborate. He believes solving these problems are key to building the next generation of workstations.
The How:
Rukman talks about the following 3 ground rules used in solving these problems:
1. get the user the right amount of information/controls
2. at the right time
3. at the right place
While that’s the broad framework, he elaborates that bRight does this using:
1. Gesture recognition
2. Touch recognition
3. Gaze detection
4. Cognitive modeling
These are intricate concepts to explain in an article, and I highly recommend you watch the entire 54 minute video. But if you’d rather skip to the juicy parts, here’s what I suggest:
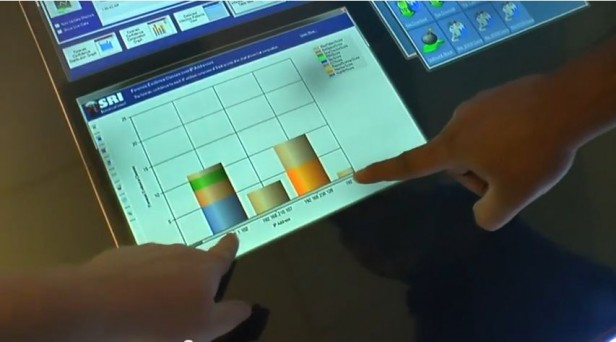
15:50 – Demo of a cyber attack on a cluster of systems. The bar chart shows the number of systems being compromised in real time, and equips the security team to quickly understand and respond to the attack.
23:26 – Demo of bRight desktop via an email application. It shows gaze tracking, and how bRight translates that information into a user’s short term memory
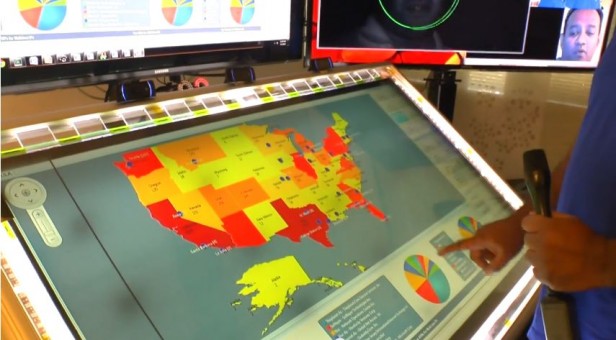
28:04 – Demo application ‘Infected America’. It uses maps & pie charts to deep dive into the data and analyze the problem
 Bonus Videos
If you’d prefer a very condensed version of the video above, you can watch the 3 short videos on the
SRI website. Do pay attention to these parts to catch a glimpse of FusionCharts Suite XT in action:
In video 2:
1:08 – Demo of ‘Infected America’ application
In Video 3:
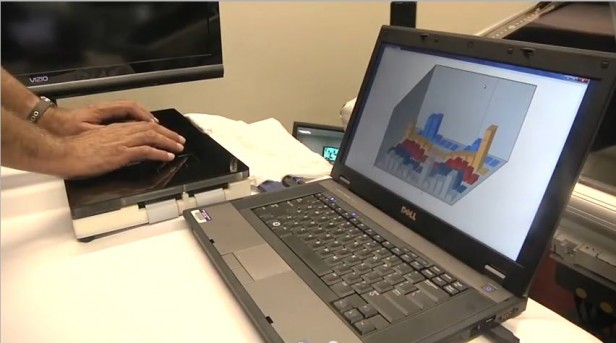
1:05 – Demo of proximity sensors on bRight Lite shown via a
3D bar graph
In conclusion, credit goes to the team at SRI for making use of the wide range of
FusionCharts Suite XT‘s capabilities, with its various chart types and maps, displayed in lively colors that make you want to touch them, and of course, following up on that with large touch screen monitors. Makes us wonder how data visualization would evolve and enhance such futuristic experience models. We’re eager to be part of that journey.
Time to have your say. Do you think it’ll take very long before this kind of technology reaches your work space? Does the thought of having a machine gaze into your eyes turn you on or spook you out?

 23:26 – Demo of bRight desktop via an email application. It shows gaze tracking, and how bRight translates that information into a user’s short term memory
28:04 – Demo application ‘Infected America’. It uses maps & pie charts to deep dive into the data and analyze the problem
23:26 – Demo of bRight desktop via an email application. It shows gaze tracking, and how bRight translates that information into a user’s short term memory
28:04 – Demo application ‘Infected America’. It uses maps & pie charts to deep dive into the data and analyze the problem
 Bonus Videos
If you’d prefer a very condensed version of the video above, you can watch the 3 short videos on the SRI website. Do pay attention to these parts to catch a glimpse of FusionCharts Suite XT in action:
In video 2:
1:08 – Demo of ‘Infected America’ application
Bonus Videos
If you’d prefer a very condensed version of the video above, you can watch the 3 short videos on the SRI website. Do pay attention to these parts to catch a glimpse of FusionCharts Suite XT in action:
In video 2:
1:08 – Demo of ‘Infected America’ application
 In Video 3:
1:05 – Demo of proximity sensors on bRight Lite shown via a 3D bar graph
In Video 3:
1:05 – Demo of proximity sensors on bRight Lite shown via a 3D bar graph
 In conclusion, credit goes to the team at SRI for making use of the wide range of FusionCharts Suite XT‘s capabilities, with its various chart types and maps, displayed in lively colors that make you want to touch them, and of course, following up on that with large touch screen monitors. Makes us wonder how data visualization would evolve and enhance such futuristic experience models. We’re eager to be part of that journey.
Time to have your say. Do you think it’ll take very long before this kind of technology reaches your work space? Does the thought of having a machine gaze into your eyes turn you on or spook you out?
In conclusion, credit goes to the team at SRI for making use of the wide range of FusionCharts Suite XT‘s capabilities, with its various chart types and maps, displayed in lively colors that make you want to touch them, and of course, following up on that with large touch screen monitors. Makes us wonder how data visualization would evolve and enhance such futuristic experience models. We’re eager to be part of that journey.
Time to have your say. Do you think it’ll take very long before this kind of technology reaches your work space? Does the thought of having a machine gaze into your eyes turn you on or spook you out?