
We live in a world where experiences are defined by the ‘right here, right now.’ As a result, our initial reaction to any event is, “Are we getting this in real-time? “From wildfires raging across California to Keisha’s stellar Grammy performance or your next Facebook update,’ real-time’ command value is unrivaled.”
Real-time data is information that is delivered immediately after it is collected, with no (or nearly no) lag. Consider a live sports broadcast: you’ve placed a $50 bet based on how they’re playing because you have real-time data. This information would be useless the day after the game.
The same theory holds true for stock markets, crisis response scenarios, infrastructure maintenance, and other areas. Because the possibilities are endless, real-time data has become the new oil for modern businesses.
So the question is: how do we access data and interact with it in real-time? We’ll find out the answers in this post and show you how to use Data Visualization Tool to create real-time data and charts with socket.io and fusioncharts.
 A real-time chart adds a lot of value to your website/ app because the user can have the latest data without performing any action or refreshing the page. This improves the user experience and promotes brand loyalty.
If you find any errors in your code or have trouble executing the above sample, click here to download the complete source code of the sample project we have created for this tutorial.
A real-time chart adds a lot of value to your website/ app because the user can have the latest data without performing any action or refreshing the page. This improves the user experience and promotes brand loyalty.
If you find any errors in your code or have trouble executing the above sample, click here to download the complete source code of the sample project we have created for this tutorial.
Table of Contents
Charts and Visualization
Real-time charts and data visualization in real-time is your answer. Also called data-streaming charts (because these are almost like live video feeds), they are automatically updated after every ‘n’ seconds. The updated data is fetched straight from the server, and no page refreshes are required from the user’s end. Therefore, you have access to the latest and most relevant information whenever you look at the chart. Data flows into real-time charts via WebSockets – an internet communication protocol that lets the client and the server talk to each other in real-time and keeps data moving both ways (in other words, a persistent connection). Because the server can also fetch information from the client, you could also set up an event-based system. The server and the client can both react to triggers received on the connection. Socket.IO is a utility built on WebSocket that makes it easy to integrate real-time information into Node.js applications (linking server-side data to the client).Here’s How It Works:
Socket.IO uses Node.js’ asynchronous and event-based approaches. You could listen to a connection event, fire up a function when a new user connects to the server, emit a message (primarily an event) over a socket, and much more. Many companies and developers use it for instant messaging, real-time analytics and monitoring, streaming platforms, and document collaboration. From Slack to Snapchat and Fox TV, you name it, and Socket.IO is probably powering it.Creating a Real-Time Chart Using Socket.IO
Let’s dive in – in this tutorial, we’re using PubNub as our data source. This is a global Data Stream Network and Infrastructure-as-a-Service company that pioneers in real-time technologies. They use a Publish/Subscribe model for real-time data streaming and device signaling. As a result, you can establish and maintain persistent socket connections to any device and push data to global audiences in less than ¼ of a second. There are three steps you’d need to perform:- First, we incorporate all the requisite components – Socket.IO, PubNub, FusionCharts, Webpack, and Nodemon.
- Then, we create all the files required.
- Finally, we start the server to render the chart.
Part 1
1. Socket.IO: Socket.IO will work with a web server that we’ll build using Express. To start developing with Socket.IO, you need to install Node and npm (node package manager). Open your terminal and enter the following commands to create a new folder:mkdir test-project
Navigate to the project folder (cd test-project) and type the following command in the terminal:
npm init
It will ask you some questions about your project; answer them accordingly.
This will create a package.json configuration file. Now, we need to install Express and Socket.IO. To install these and save them to the package.json file, enter the following command in your terminal, into the project directory:
npm install --save express socket.io
2. PubNub: For creating a real-time chart, we will fetch data from PubNub. Install PubNub via npm, using the command given below:
npm install --save pubnub
3. FusionCharts: Now it’s time to install FusionCharts using the following command:
npm install --save fusioncharts
4. Webpack: Currently, the FusionCharts library is not ES6 compatible, so we will use webpack to bundle the file. So first, we will install the webpack using the following command:
npm install --save webpack
To fulfill our motive behind using the webpack, we add the line shown below in our package.json inside the scripts:
"bundle": "webpack src/src.js dist/bundle.js"
The above line will bundle the JS file present inside the src folder and create a bundle.js file inside the dist folder.
Now, make sure that the code inside package.json looks like the code shown below:
{
  "name": "socket.io_sample",
  "version": "1.0.0",
  "description": "",
  "main": "index.js",
  "scripts": {
    "test": "echo \"Error: no test specified\" && exit 1",
    "bundle": "webpack src/src.js dist/bundle.js"
  },
  "author": "FusionCharts",
  "license": "ISC",
  "dependencies": {
    "express": "^4.16.2",
    "fusioncharts": "^3.12.2",
    "pubnub": "^4.20.0",
    "socket.io": "^2.0.4",
    "webpack": "^3.10.0"
  }
}
The installation part of creating real-time charts using Socket.IO ends here.
Part 2
Now, create a file calledapp.js and enter the following code to set up an Express application along with Socket.IO:
var express = require('express');
var app = require('express')();
var http = require('http').Server(app);
//creates a new socket.io instance attached to the http server.
var io = require('socket.io')(http);
//Include PubNub JavaScript SDK
var PubNub = require('pubnub');

//Provide the absolute path to the dist directory.
app.use(express.static('path/to/dist_folder'));

//On get request send 'index.html' page as a response.
app.get('/', function(req, res) {
   res.sendfile('index.html');
});

//Whenever someone connects, this gets executed

io.on('connection', function (socket) {
	var strData;
//Instantiate a new Pubnub instance along with the subscribeKey
	pubnub = new PubNub({
        subscribeKey : 'sub-c-4377ab04-f100-11e3-bffd-02ee2ddab7fe'
    })
    //adding listener to pubnub
    pubnub.addListener({
        message: function(message) {
/*checking whether the message contains data for the ‘Apple’ category or not.*/
        	if(message.message.symbol=='Apple'){
                        /*Creates a new date object from the specified message.timestamp.*/
        		var x = new Date(message.message.timestamp);
//Converting the timestamp into a desired format. HH:MM:SS:MS
		var formatted =  (x.getHours()) + ':' + (x.getMinutes()) + ':' + (x.getSeconds()) + ':' + (x.getMilliseconds());
                       /*Here we are creating an object which will contain a timestamp as label and the ‘order_quantity’ as value.*/
        		strData = {"label": formatted,
						   "value":message.message.order_quantity
						}
                                               //sending data to the client
				socket.emit('news', strData);
        	};
        }
    })
    console.log("Subscribing..");
//Subscribe the PubNub channel
    pubnub.subscribe({
        channels: ['pubnub-market-orders']
    });
});
//server listening on port 3000
http.listen(3000, function() {
   console.log('listening on *:3000');
});
(The tutorial uses data from PubNub to illustrate real-time market orders. Click here to learn how you can use PubNub with Node.js.)
We need an index.html file to serve. Create a new file called index.html and enter the following code in it:
<!DOCTYPE html>
<html>
   <head>
      <title>Hello world</title>
      <script src="/socket.io/socket.io.js"></script>
   </head>

   <body>
   		<div id="chart-container">FusionCharts will render here</div>
        <script src="bundle.js"></script>
   </body>
</html>
As you can see in the above code, apart from socket.io.js we have included another file named bundle.js.
We also need one more js file to make sure that the HTML file doesn’t become bulky – so we have created a file named src.js.
Using webpack, we have bundled that src.js file with the following command:
npm run bundle
This results in the bundle.js file inside a dist folder.
The above process is required to render FusionChart using Node.JS.
Below is the code written inside the src.js file:
var FusionCharts = require("fusioncharts");
require("fusioncharts/fusioncharts.charts")(FusionCharts);
require("fusioncharts/fusioncharts.widgets")(FusionCharts);

  var socket = io('http://localhost:3000/');
    	var transactionChart = new FusionCharts({
    		id: "mychart",
	        type: 'realtimecolumn',
	        width: '700',
	        height: '350',
	        dataFormat: 'json',
	        dataSource: {
	            "chart": {
    	         "caption": "Market Orders for Apple",
                    "subCaption": "Harry Supermarket",
                    "yaxismaxvalue": "10",
                    "numdisplaysets": "10",
                    "yAxisName":"Quantity",
                    "labeldisplay": "rotate",
                    "showLegend":"0",
                    "showValues": "0",
                    "numbersuffix": "Kg",
                    "showlabels": "1",
/*This parameter lets you set whether you want the latest value (received from server) to be displayed on the chart or not*/
                    "showRealTimeValue": "0",
/*For this parameter, you can specify the number of seconds after which the chart will look for new data. This process will happen continuously - i.e., if you specify 5 seconds here, the chart will look for new data every 5 seconds*/
                     "refreshInterval":".1",
/*If you want the chart to keep polling for new data every x seconds and queue it, you can specify that x seconds as updateInterval. This helps you poll at different intervals and then draw at another interval (specified as refreshInterval)*/
                    "updateInterval":".1",
                    "yAxisNamePadding":"10",
                    //Cosmetics
                    "paletteColors" : "#0075c2,#1aaf5d",
                    "baseFontColor" : "#333333",
                    "baseFont" : "Helvetica Neue,Arial",
                    "captionFontSize" : "14",
                    "subcaptionFontSize" : "14",
                    "subcaptionFontBold" : "0",
                    "showBorder" : "0",
                    "bgColor" : "#ffffff",
                    "showShadow" : "0",
                    "canvasBgColor" : "#ffffff",
                    "canvasBorderAlpha" : "0",
                    "divlineAlpha" : "100",
                    "divlineColor" : "#999999",
                    "divlineThickness" : "1",
                    "divLineIsDashed" : "1",
                    "divLineDashLen" : "1",
                    "divLineGapLen" : "1",
                    "usePlotGradientColor" : "0",
                    "showplotborder" : "0",
                    "valueFontColor" : "#ffffff",
                    "placeValuesInside" : "1",
                    "rotateValues" : "1",
                    "showXAxisLine" : "1",
                    "xAxisLineThickness" : "1",
                    "xAxisLineColor" : "#999999",
                    "showAlternateHGridColor" : "0",
                    "legendBgAlpha" : "0",
                    "legendBorderAlpha" : "0",
                    "legendShadow" : "0",
                    "legendItemFontSize" : "10",
                    "legendItemFontColor" : "#666666"
    	            },
	            "categories": [
	                {
	                    "category": [
	                        { "label": "Start" }
	                    ]
	                }
	            ],
	            "dataset": [
	                {
	                    "seriesname": "",
	                    "alpha": "100",
	                    "data": [
	                        { "value": "3" }
	                    ]
	                }
	            ]
	        }
    	}).render("chart-container");
//On connection with socket, will start receiving the data
	  socket.on('news', function (data) {
	    function updateData() {
                         //Converting the fetched data in FusionCharts format
	    	var strData = "&label=" + data.label + "&value=" + data.value;
                        //feeding the data to the real time chart
	    	FusionCharts.items.mychart.feedData(strData);
	    }
	    //calling the update method
	    updateData();

	 });
The coding part of the process ends here.
Part 3
Now we will start our server using the following command:node app.js
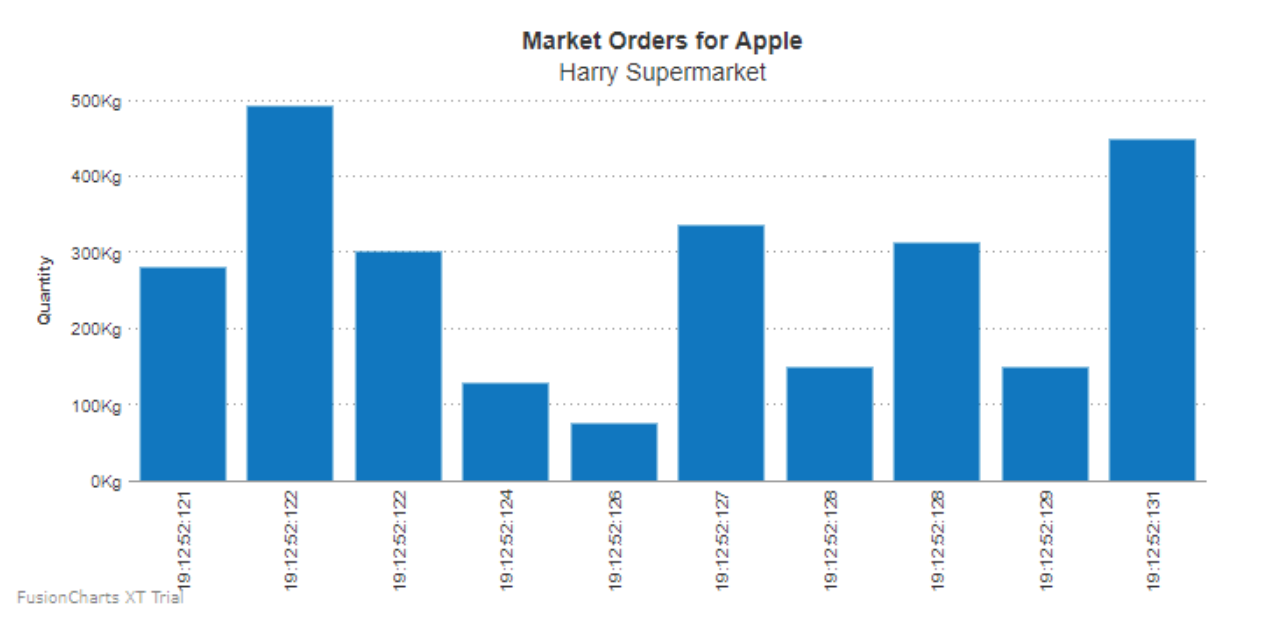
Now, check the URL http://localhost:3000/. A beautiful real-time chart will be rendered on the screen, as shown below:
A real-time chart adds a lot of value to your website/ app because the user can have the latest data without performing any action or refreshing the page. This improves the user experience and promotes brand loyalty.
If you find any errors in your code or have trouble executing the above sample, click here to download the complete source code of the sample project we have created for this tutorial.