5 tips for writing great chart captions

Your users are becoming busier by the day. Your charts are packing in more info, and are becoming denser by the day. As a result, if users need more than a few seconds to grasp the significance of the data plots, we’ve lost the game. We need to provide the meta information in a concise manner to enable at-a-glance comprehension. This is where the chart caption comes into focus. It occupies a very prominent place in a chart, and a well-written caption makes a chart much easier to comprehend by an order of magnitude. In this post let us review a few tips in writing concise and telling captions.
Summarize the chart data in plain English
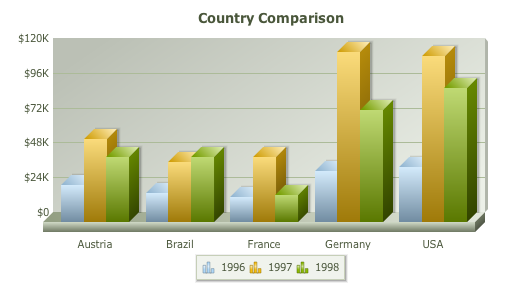
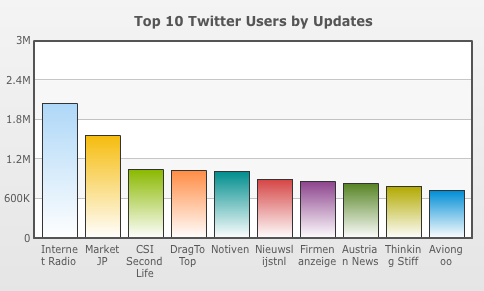
You should try to encapsulate the entire story the chart is telling you. The caption occupies the top-most place in a chart, and the user can know what to look for in the chart. For instance, in the chart below, the caption doesn’t tell the user what the comparison is about. The values don’t say whether they’re revenues, or profits, or losses.
Include the units of representation
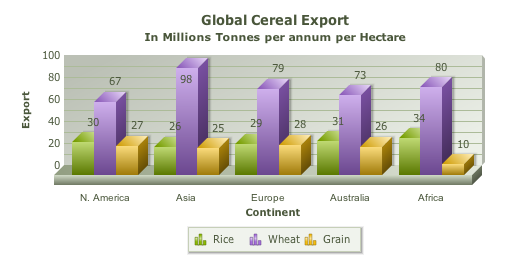
You should include the unit of representation of data in the caption, or in the sub-caption. For example, if your chart is about the half yearly revenue of a company, you should use the caption “Half yearly revenue (2011)” with a sub-caption: "($ in millions)". Usually the unit is mentioned in a smaller font along the axes. Mentioning it in the caption gives the unit more visual prominence.
Include the time period
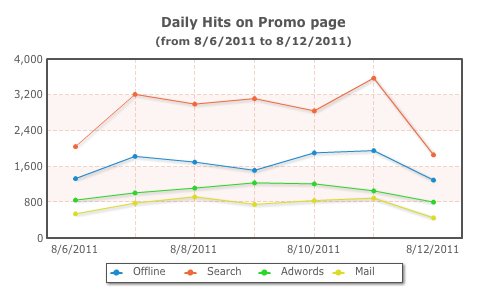
If your chart shows the trend of a data set over a certain period of time, make sure to mention it in the caption. It can be written as the sub-caption of the chart to save space, or if your caption is already long. Time period is generally represented in brackets.
Avoid using articles like a, an, the
Another important rule is to keep the caption short and precise. Support the rule by avoiding the usage of unnecessary articles (a, an, the). Consider the two following sentences:
The annual revenue of the years 2010 vs 2011
Vs
Annual revenue of 2010 vs 2011
The second option holds the specificity of the data without any loss of information. The unwanted articles have been removed without compromising the credibility of the chart caption.
Vs
Adjectives are a strict no-no
Get rid of adjectives. Stick to the previous rule. Consider the following two options:
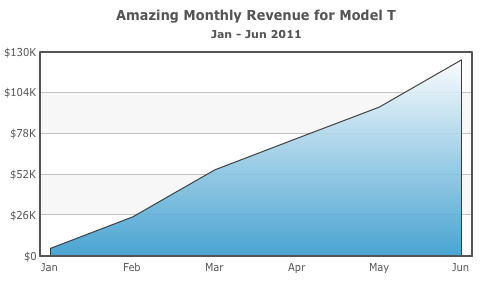
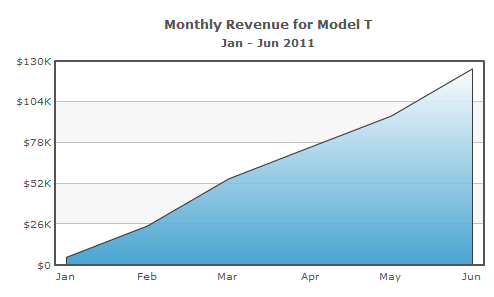
Amazing Monthly Revenues for Model T
Vs
Monthly Revenues for Model T
Save the user from hyperbole. Again you can see that even when you exclude the adjectives, there is no loss in the integrity of the information. Instead you present a more concise caption.
Vs
Writing apt and concise captions will be an easy task by using the tips above. Captioning your charts make them easier to comprehend, and their returns-on-time-spent-interpreting-charts is sure to increase. Your users will thank you for this. Happy charting!


