Logging Export Statistics
Starting v3.12.1, FusionCharts Suite XT introduces a feature that lets users log export statistics. With the help of this feature, among many other details, a user can obtain the following statistics:
- Type of the exported chart
- Selected export format
- Filename of the exported file
- Time zone of the user who has exported the chart
- Whether the user (exporting the chart) is using the licensed version or the trial version of the product
The implementation of this feature helps to monitor the usage of the export server in either case—when the FusionCharts’ public server is being used as well as when a customer’s private export server is being used. Logging the export statistics helps to understand end user behavior and aids in crucial product management decisions.
The chart shown below is rendered with the logging feature enabled.
{
"chart": {
"caption": "Monthly Revenue",
"subCaption": "Last year",
"xAxisName": "Month",
"yAxisName": "Amount (In USD)",
"numberPrefix": "$",
"canvasBgAlpha": "0",
"bgColor": "#DDDDDD",
"bgAlpha": "50",
"exportEnabled": "1",
"logEnabled": "1",
"logMode": "auto",
"theme": "fusion"
},
"data": [
{
"label": "Jan",
"value": "420000"
},
{
"label": "Feb",
"value": "810000"
},
{
"label": "Mar",
"value": "720000"
},
{
"label": "Apr",
"value": "550000"
},
{
"label": "May",
"value": "910000"
},
{
"label": "Jun",
"value": "510000"
},
{
"label": "Jul",
"value": "680000"
},
{
"label": "Aug",
"value": "620000"
},
{
"label": "Sep",
"value": "610000"
},
{
"label": "Oct",
"value": "490000"
},
{
"label": "Nov",
"value": "900000"
},
{
"label": "Dec",
"value": "730000"
}
]
}<chart caption="Monthly Revenue" subcaption="Last year" xaxisname="Month" yaxisname="Amount (In USD)" numberprefix="$" canvasbgalpha="0" bgcolor="#DDDDDD" bgalpha="50" exportenabled="1" logenabled="1" logmode="auto" theme="fusion">
<set label="Jan" value="420000" />
<set label="Feb" value="810000" />
<set label="Mar" value="720000" />
<set label="Apr" value="550000" />
<set label="May" value="910000" />
<set label="Jun" value="510000" />
<set label="Jul" value="680000" />
<set label="Aug" value="620000" />
<set label="Sep" value="610000" />
<set label="Oct" value="490000" />
<set label="Nov" value="900000" />
<set label="Dec" value="730000" />
</chart><html>
<head>
<title>My first chart using FusionCharts Suite XT</title>
<script type="text/javascript" src="https://cdn.fusioncharts.com/fusioncharts/latest/fusioncharts.js"></script>
<script type="text/javascript" src="https://cdn.fusioncharts.com/fusioncharts/latest/themes/fusioncharts.theme.fusion.js"></script>
<script type="text/javascript">
FusionCharts.ready(function(){
var chartObj = new FusionCharts({
type: 'column2d',
renderAt: 'chart-container',
width: '500',
height: '300',
dataFormat: 'json',
dataSource: {
"chart": {
"caption": "Monthly Revenue",
"subCaption": "Last year",
"xAxisName": "Month",
"yAxisName": "Amount (In USD)",
"numberPrefix": "$",
"canvasBgAlpha": "0",
"bgColor": "#DDDDDD",
"bgAlpha": "50",
"exportEnabled": "1",
"logEnabled": "1",
"logMode": "auto",
"theme": "fusion"
},
"data": [{
"label": "Jan",
"value": "420000"
}, {
"label": "Feb",
"value": "810000"
}, {
"label": "Mar",
"value": "720000"
}, {
"label": "Apr",
"value": "550000"
}, {
"label": "May",
"value": "910000"
}, {
"label": "Jun",
"value": "510000"
}, {
"label": "Jul",
"value": "680000"
}, {
"label": "Aug",
"value": "620000"
}, {
"label": "Sep",
"value": "610000"
}, {
"label": "Oct",
"value": "490000"
}, {
"label": "Nov",
"value": "900000"
}, {
"label": "Dec",
"value": "730000"
}]
}
}
);
chartObj.render();
});
</script>
</head>
<body>
<div id="chart-container">FusionCharts XT will load here!</div>
</body>
</html>The logging details can be handled by the export server as well as by the log server. In case of server-side export and auto-export, both of which involve a call to the export server in the export process flow, the export server handles the logging details. In case of client-side export, wherein the entire exporting process is carried out on the client, the client makes a separate call to the log server, which then handles the logging details.
Analytics UI for Logging Details
The analytics UI has been developed in such a way that the log reports will work in all modern browsers and can be easily consumed by the users. This also helps the administrator to easily keep a tab on the entire volume of exports as well as on individual exports.
This is how the analytics UI looks:
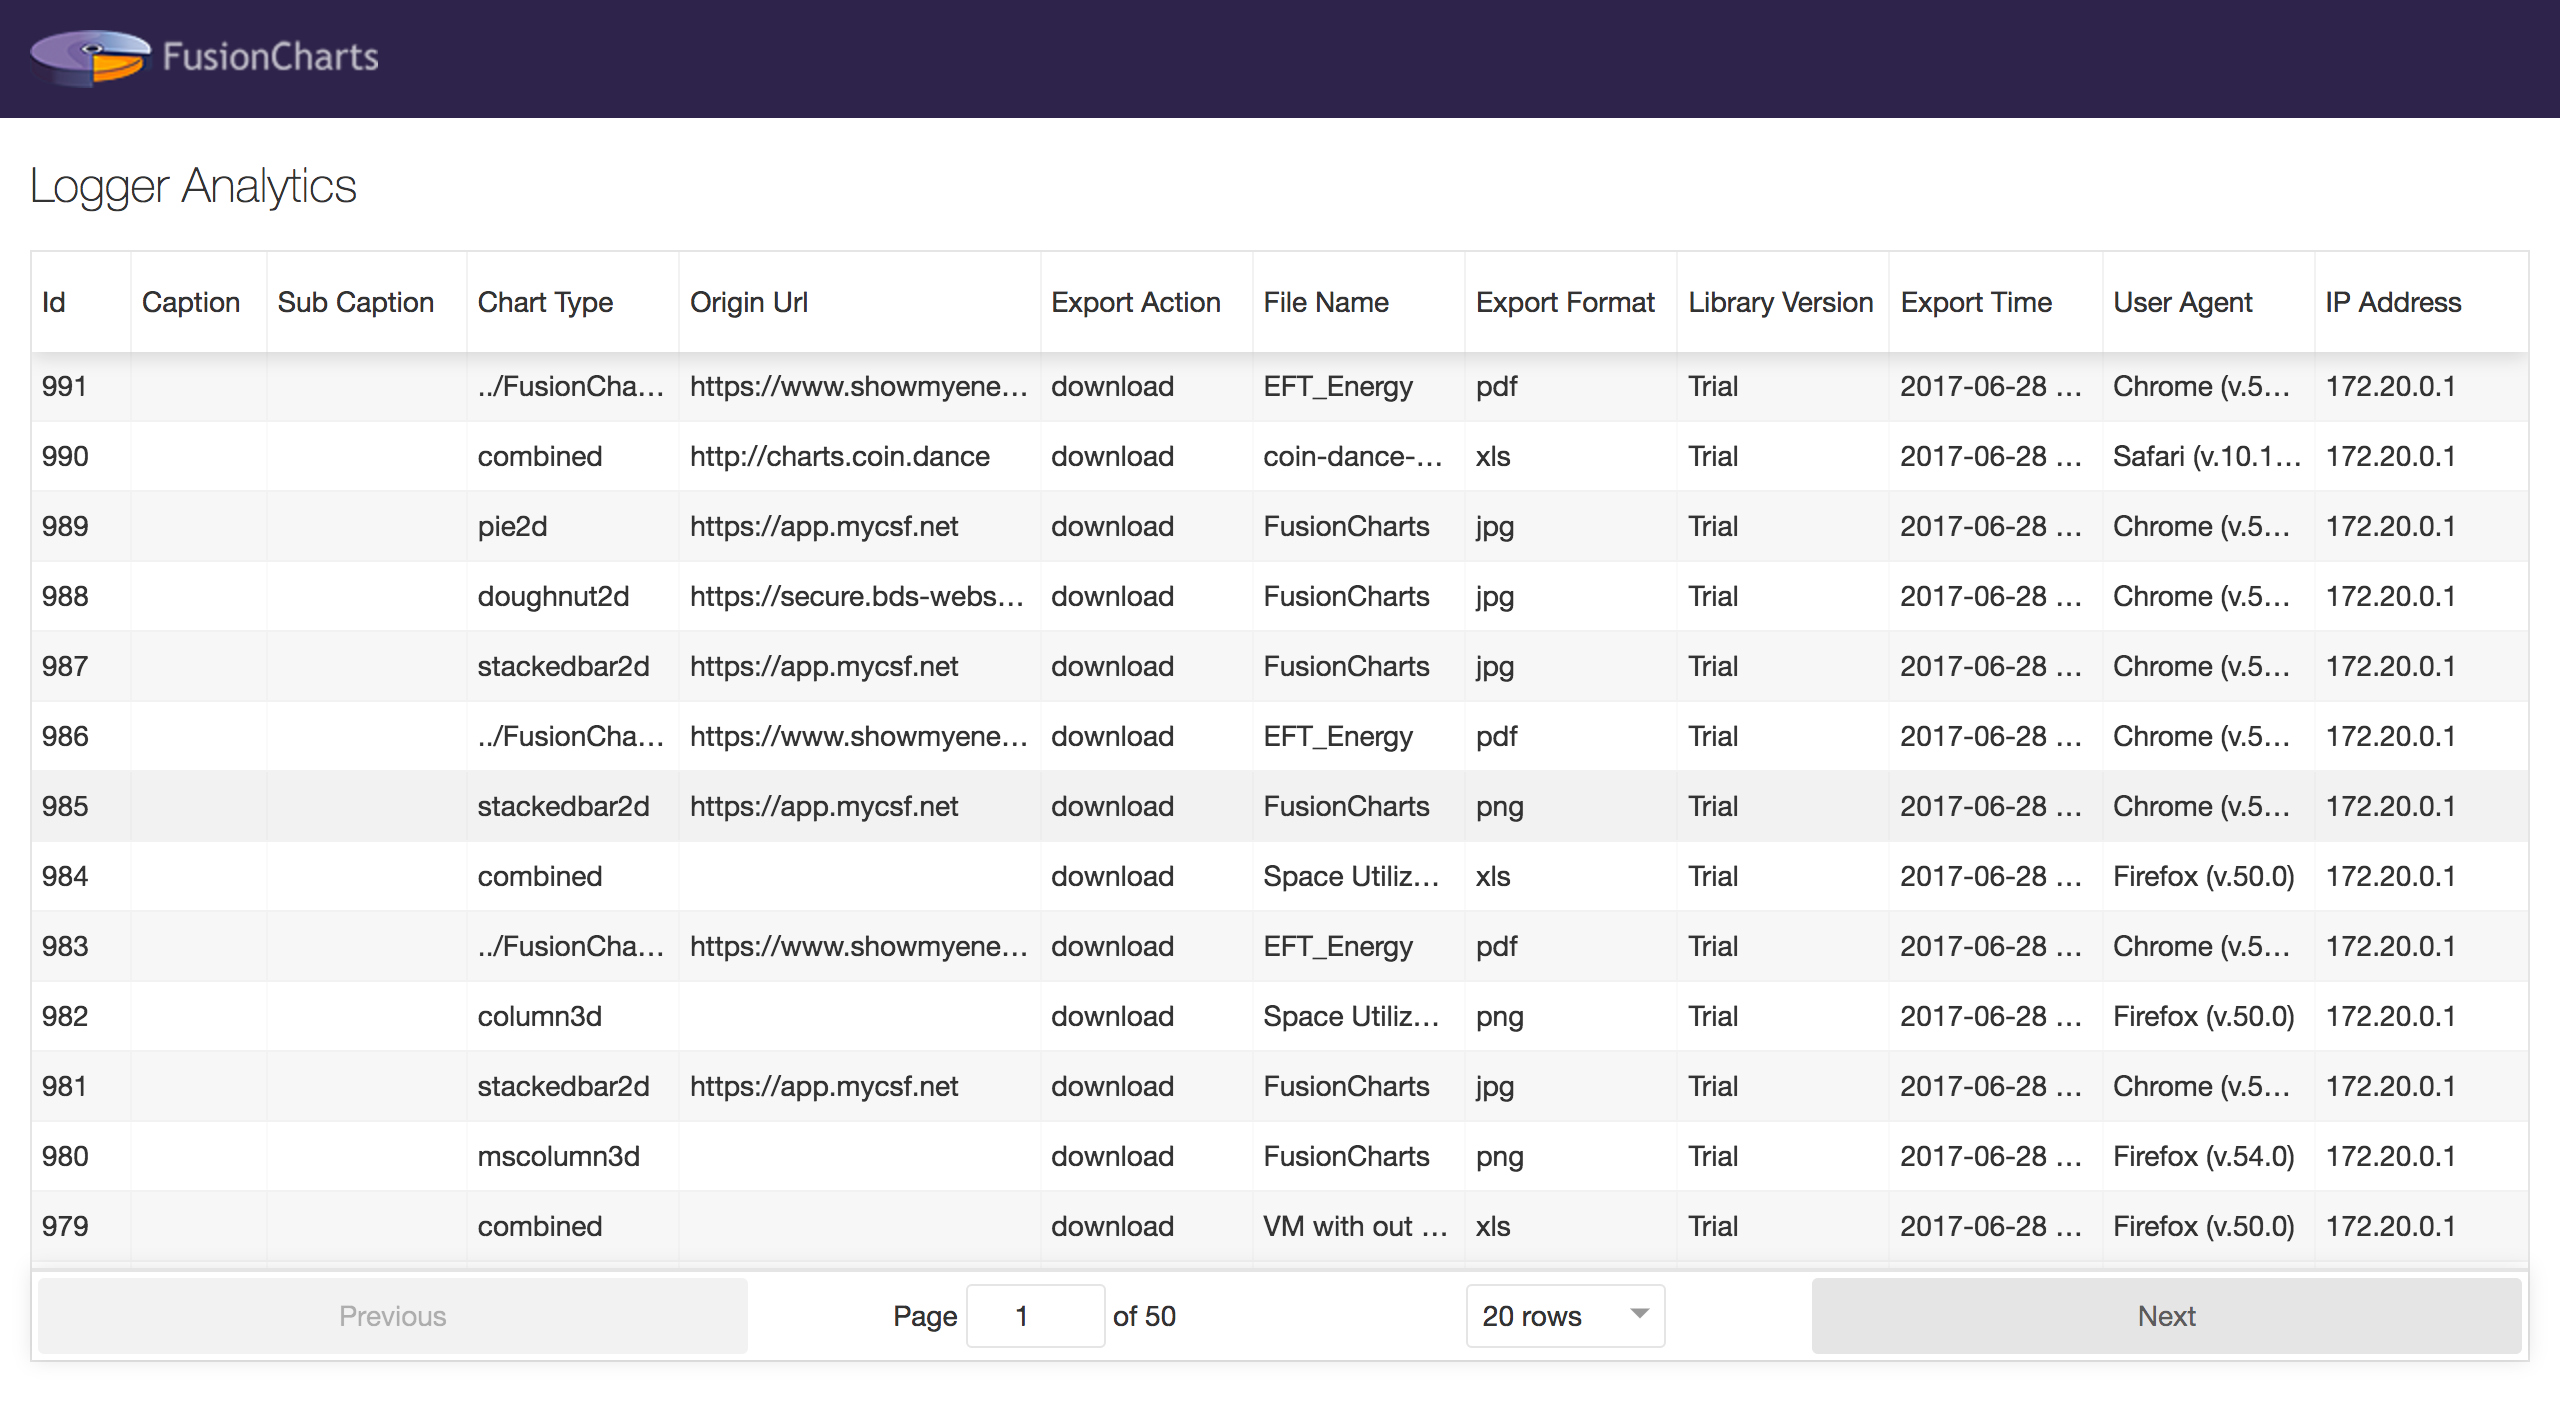
An end user can view logs only if the user has setup his own export server. In this case, the logs can be seen at {USER_DOMAIN}/api/v1.0/logs.
FusionCharts provides its users with a Logger UI package that presents the logged in statistics in an easy-to-read, tabular format. The analytics UI image shown above is an example.
Users exporting through the FusionCharts public export sever will not be able to view the statistics logged.
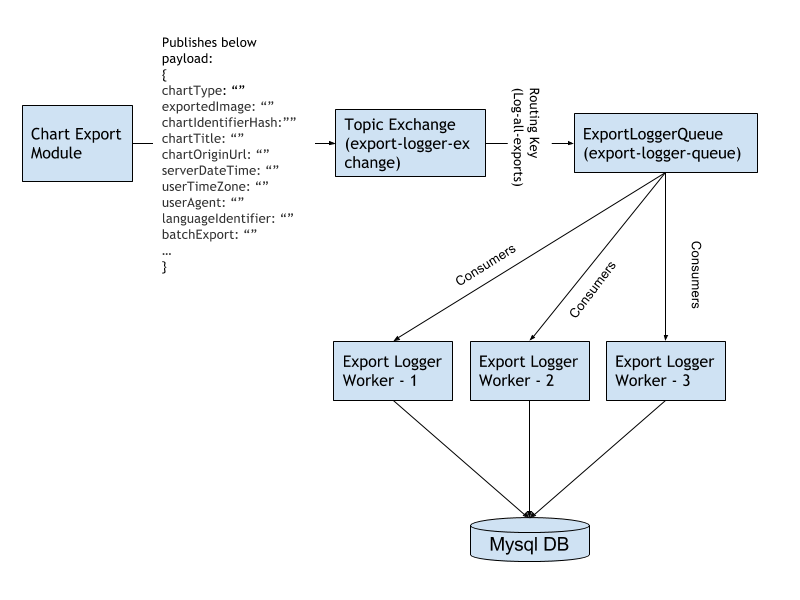
Logging Architecture
The image below shows the architecture of the export statistics logger:
Attributes Used for Enabling Logging of Export Statistics
| Attribute Name | Type | Range | Description |
|---|---|---|---|
logEnabled |
Boolean | 0/1 | Enables the logging of export statistics when set to 1 Default value: 0 (logging is disabled) |
logMode |
String | server, client, auto | Used to set the export mode for which the export statistics have to be logged Default value: auto |
logHandler |
URL | Used to set the URL for the log endpoint Default value: http://log.api3.fusioncharts.com/ The use of http or https will depend on the protocol being used. |
Export Statistics Logged
The table below gives a brief description of all the export statistics that are logged:
| Attribute Name | Type | Range | Description |
|---|---|---|---|
chartType |
String | Chart type | |
chartCaption |
String | Chart caption | |
chartSubCaption |
String | Chart sub-caption | |
isSingleExport |
Boolean | 0/1 | Used to specify whether the export will be a single chart export (1) or a batch export (0) Default value: 1 (single chart export) |
exportFilename |
String | Name of the file being exported, including the extension Default value: FusionCharts |
|
exportFormat |
String | Format of the exported file | |
chartOriginUrl |
String | URL of the origin host where the chart is embedded Read from request headers |
|
userAgent |
String | Standard browser user agent information used for browser identification Read from request headers |
|
isFullVersion |
Boolean | 0/1 | Used to specify whether the licensed version (1) or the trial version (0) is being used |
version |
String | Version no. of the FusionCharts library being used | |
userTimeZone |
String | Time zone of the user exporting the chart | |
serverDateTime |
String | Server date and time (in UTC) at the time of export | |
exportAction |
String | download, save, download-save | When a private export server is used, the action specifies the action that will be taken on export. The attribute takes the following values: - download: the exported file is only downloaded on the client and not saved on the server. - save: the exported file is only saved on the server and not downloaded on the client. - download-save: the exported file is downloaded on the client and also saved on the server - Default value: download |