On June 28th, 2013 we completed our 2nd year of operations in Bangalore. Two years of fun working in Namma Bengaluru calls for a celebration, right? So out came the chart papers and poster colors as we divided ourselves in groups of three and brought our creativity to test, by sketching our journey of two years at FusionCharts, Bangalore.
And this is what followed:
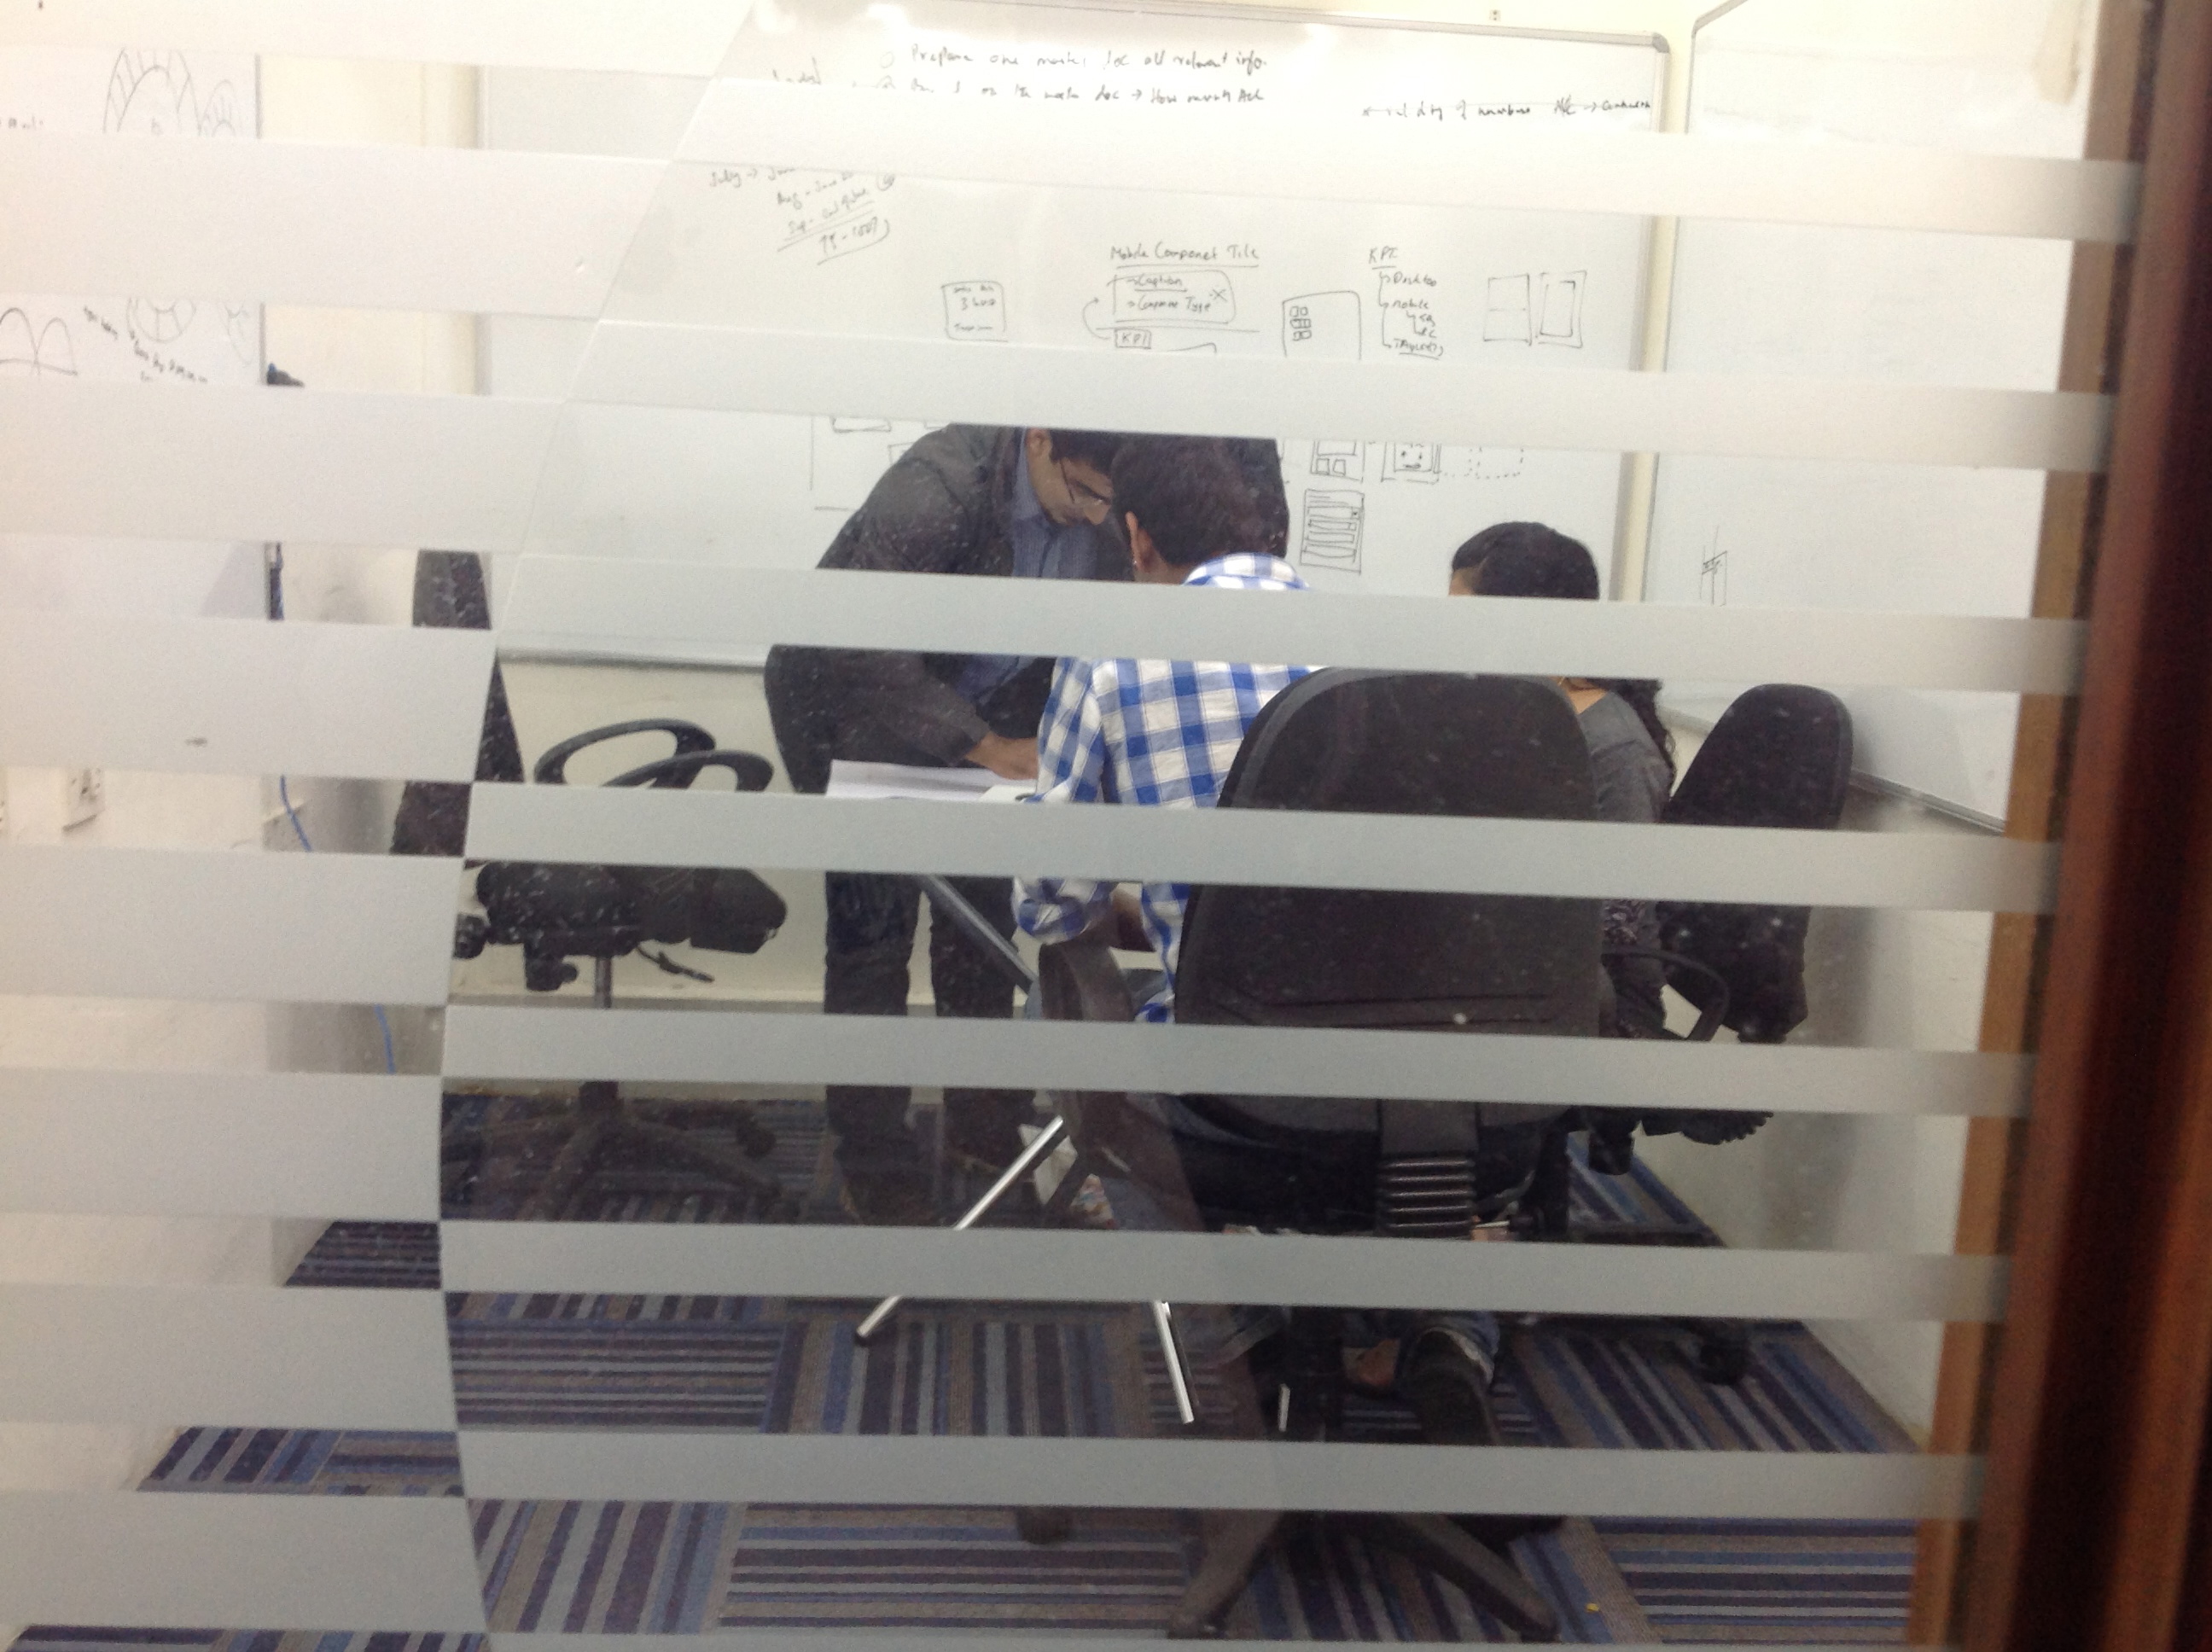
Planning behind closed doors
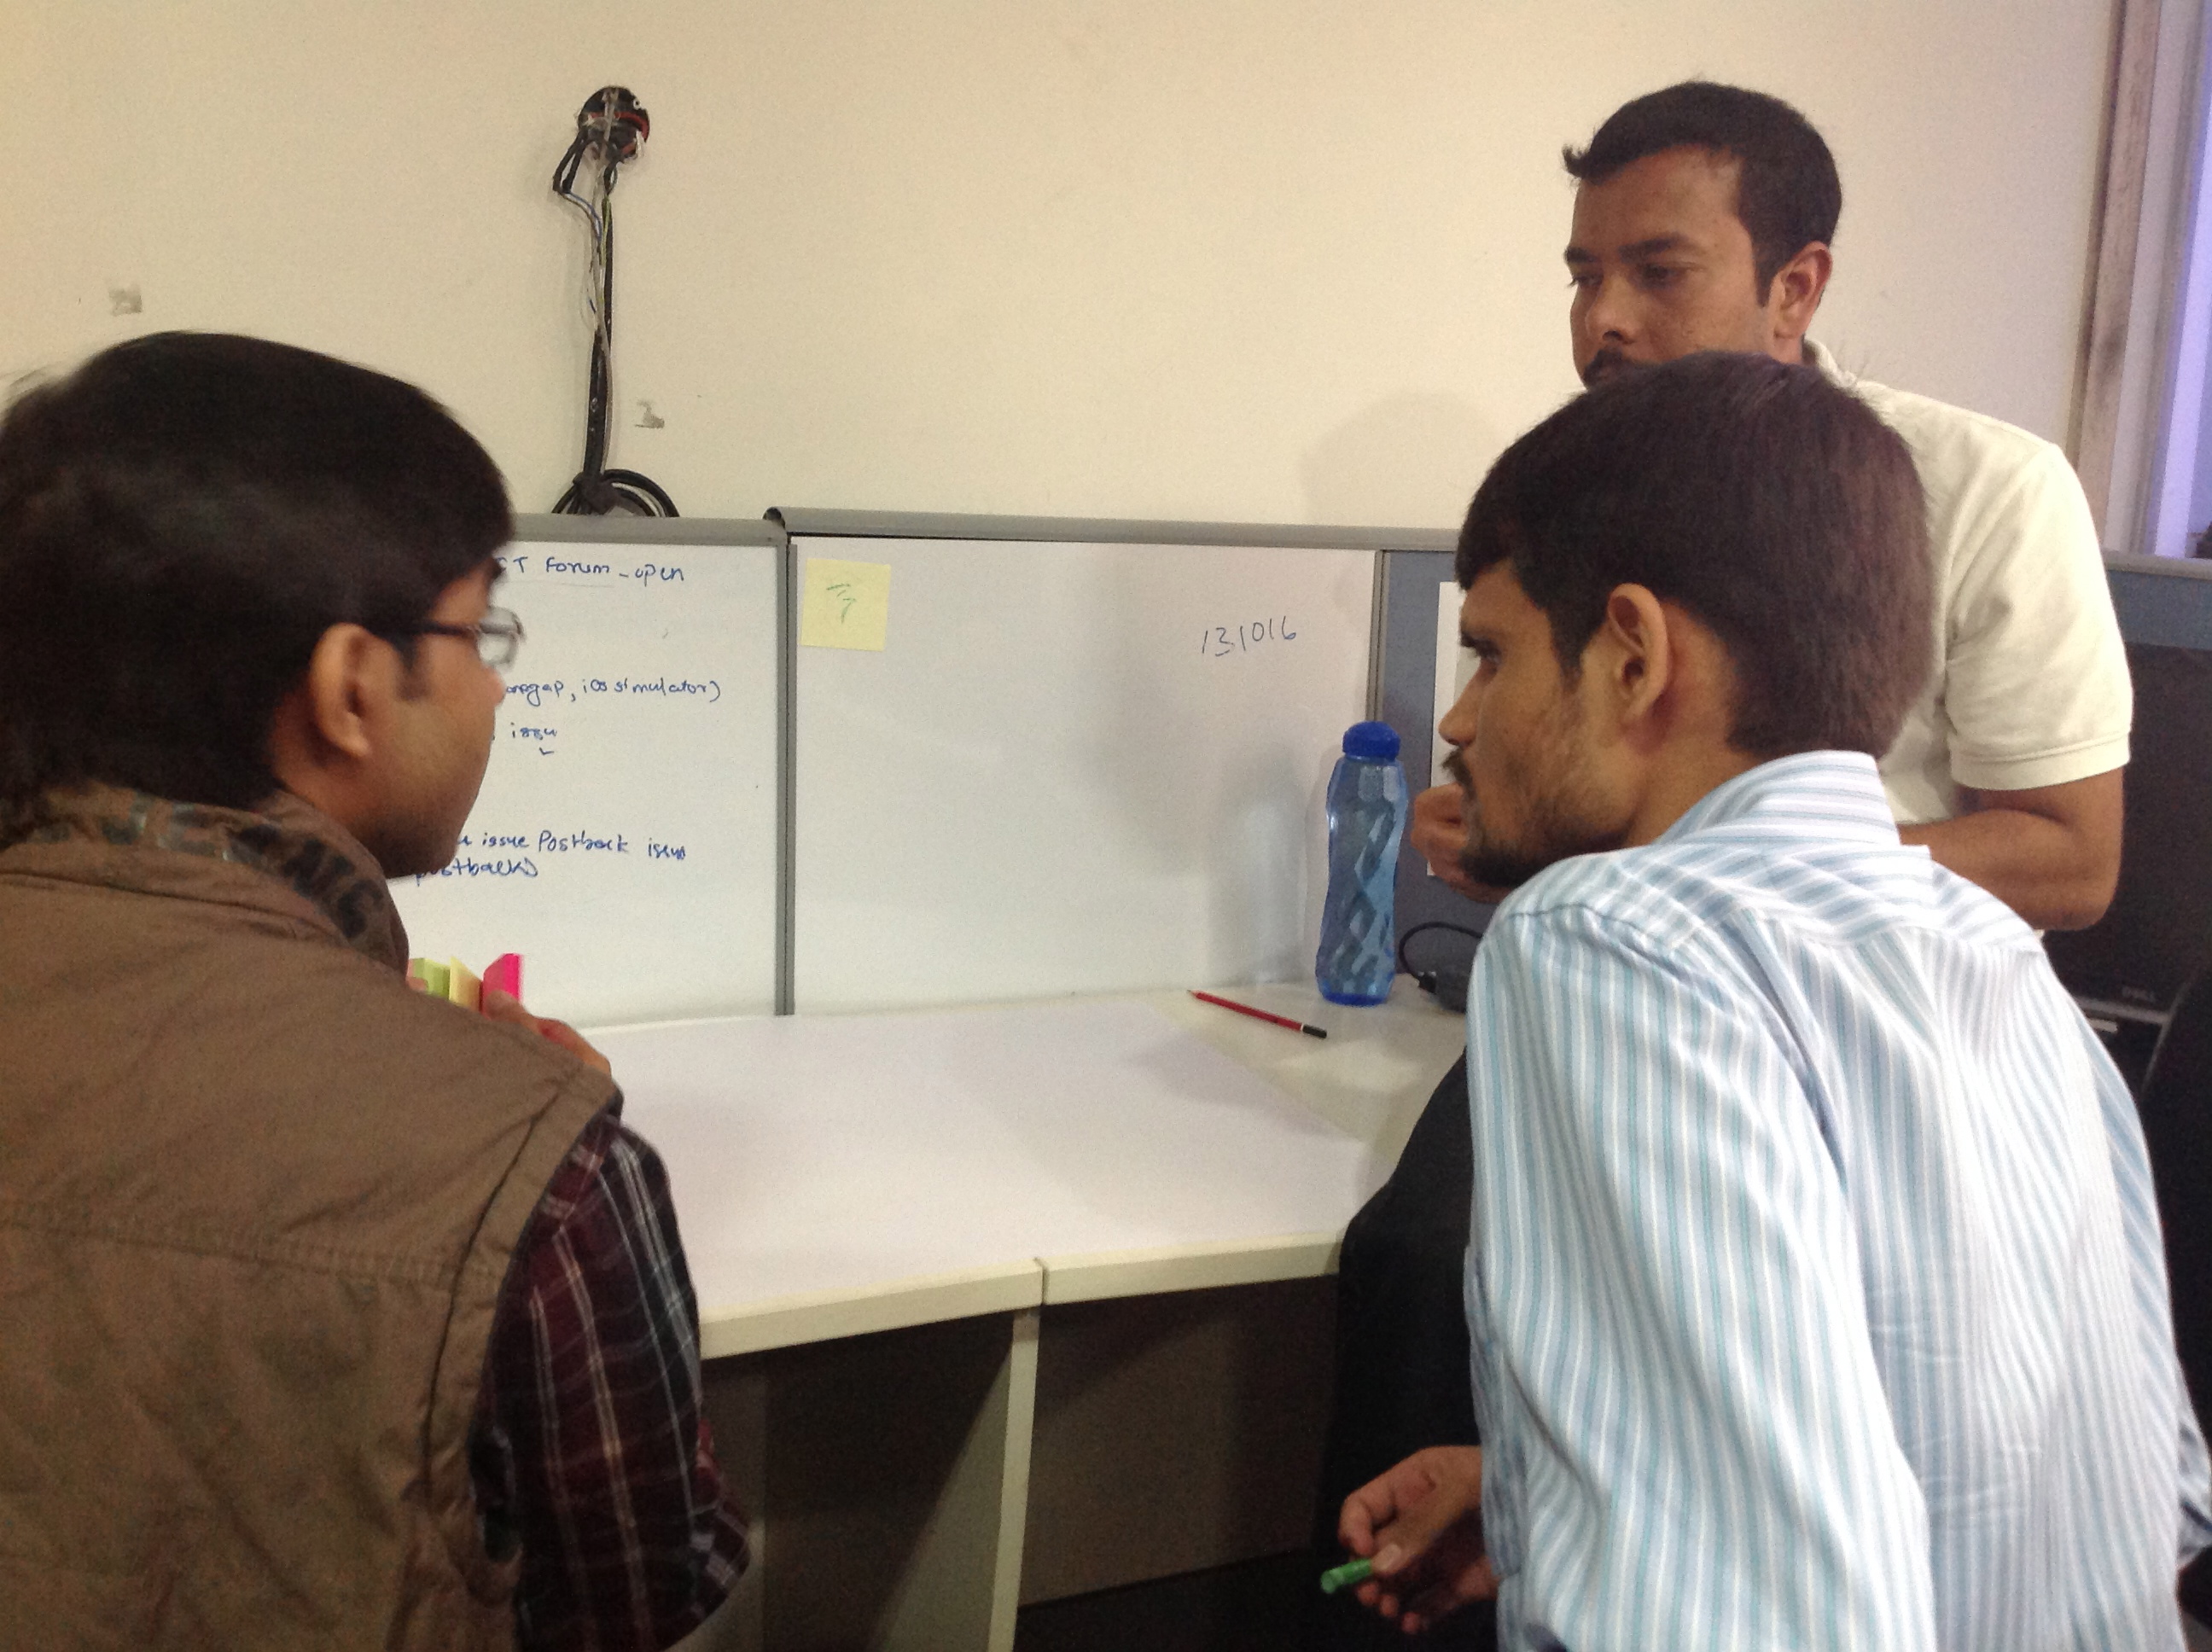
Serious brainstorming
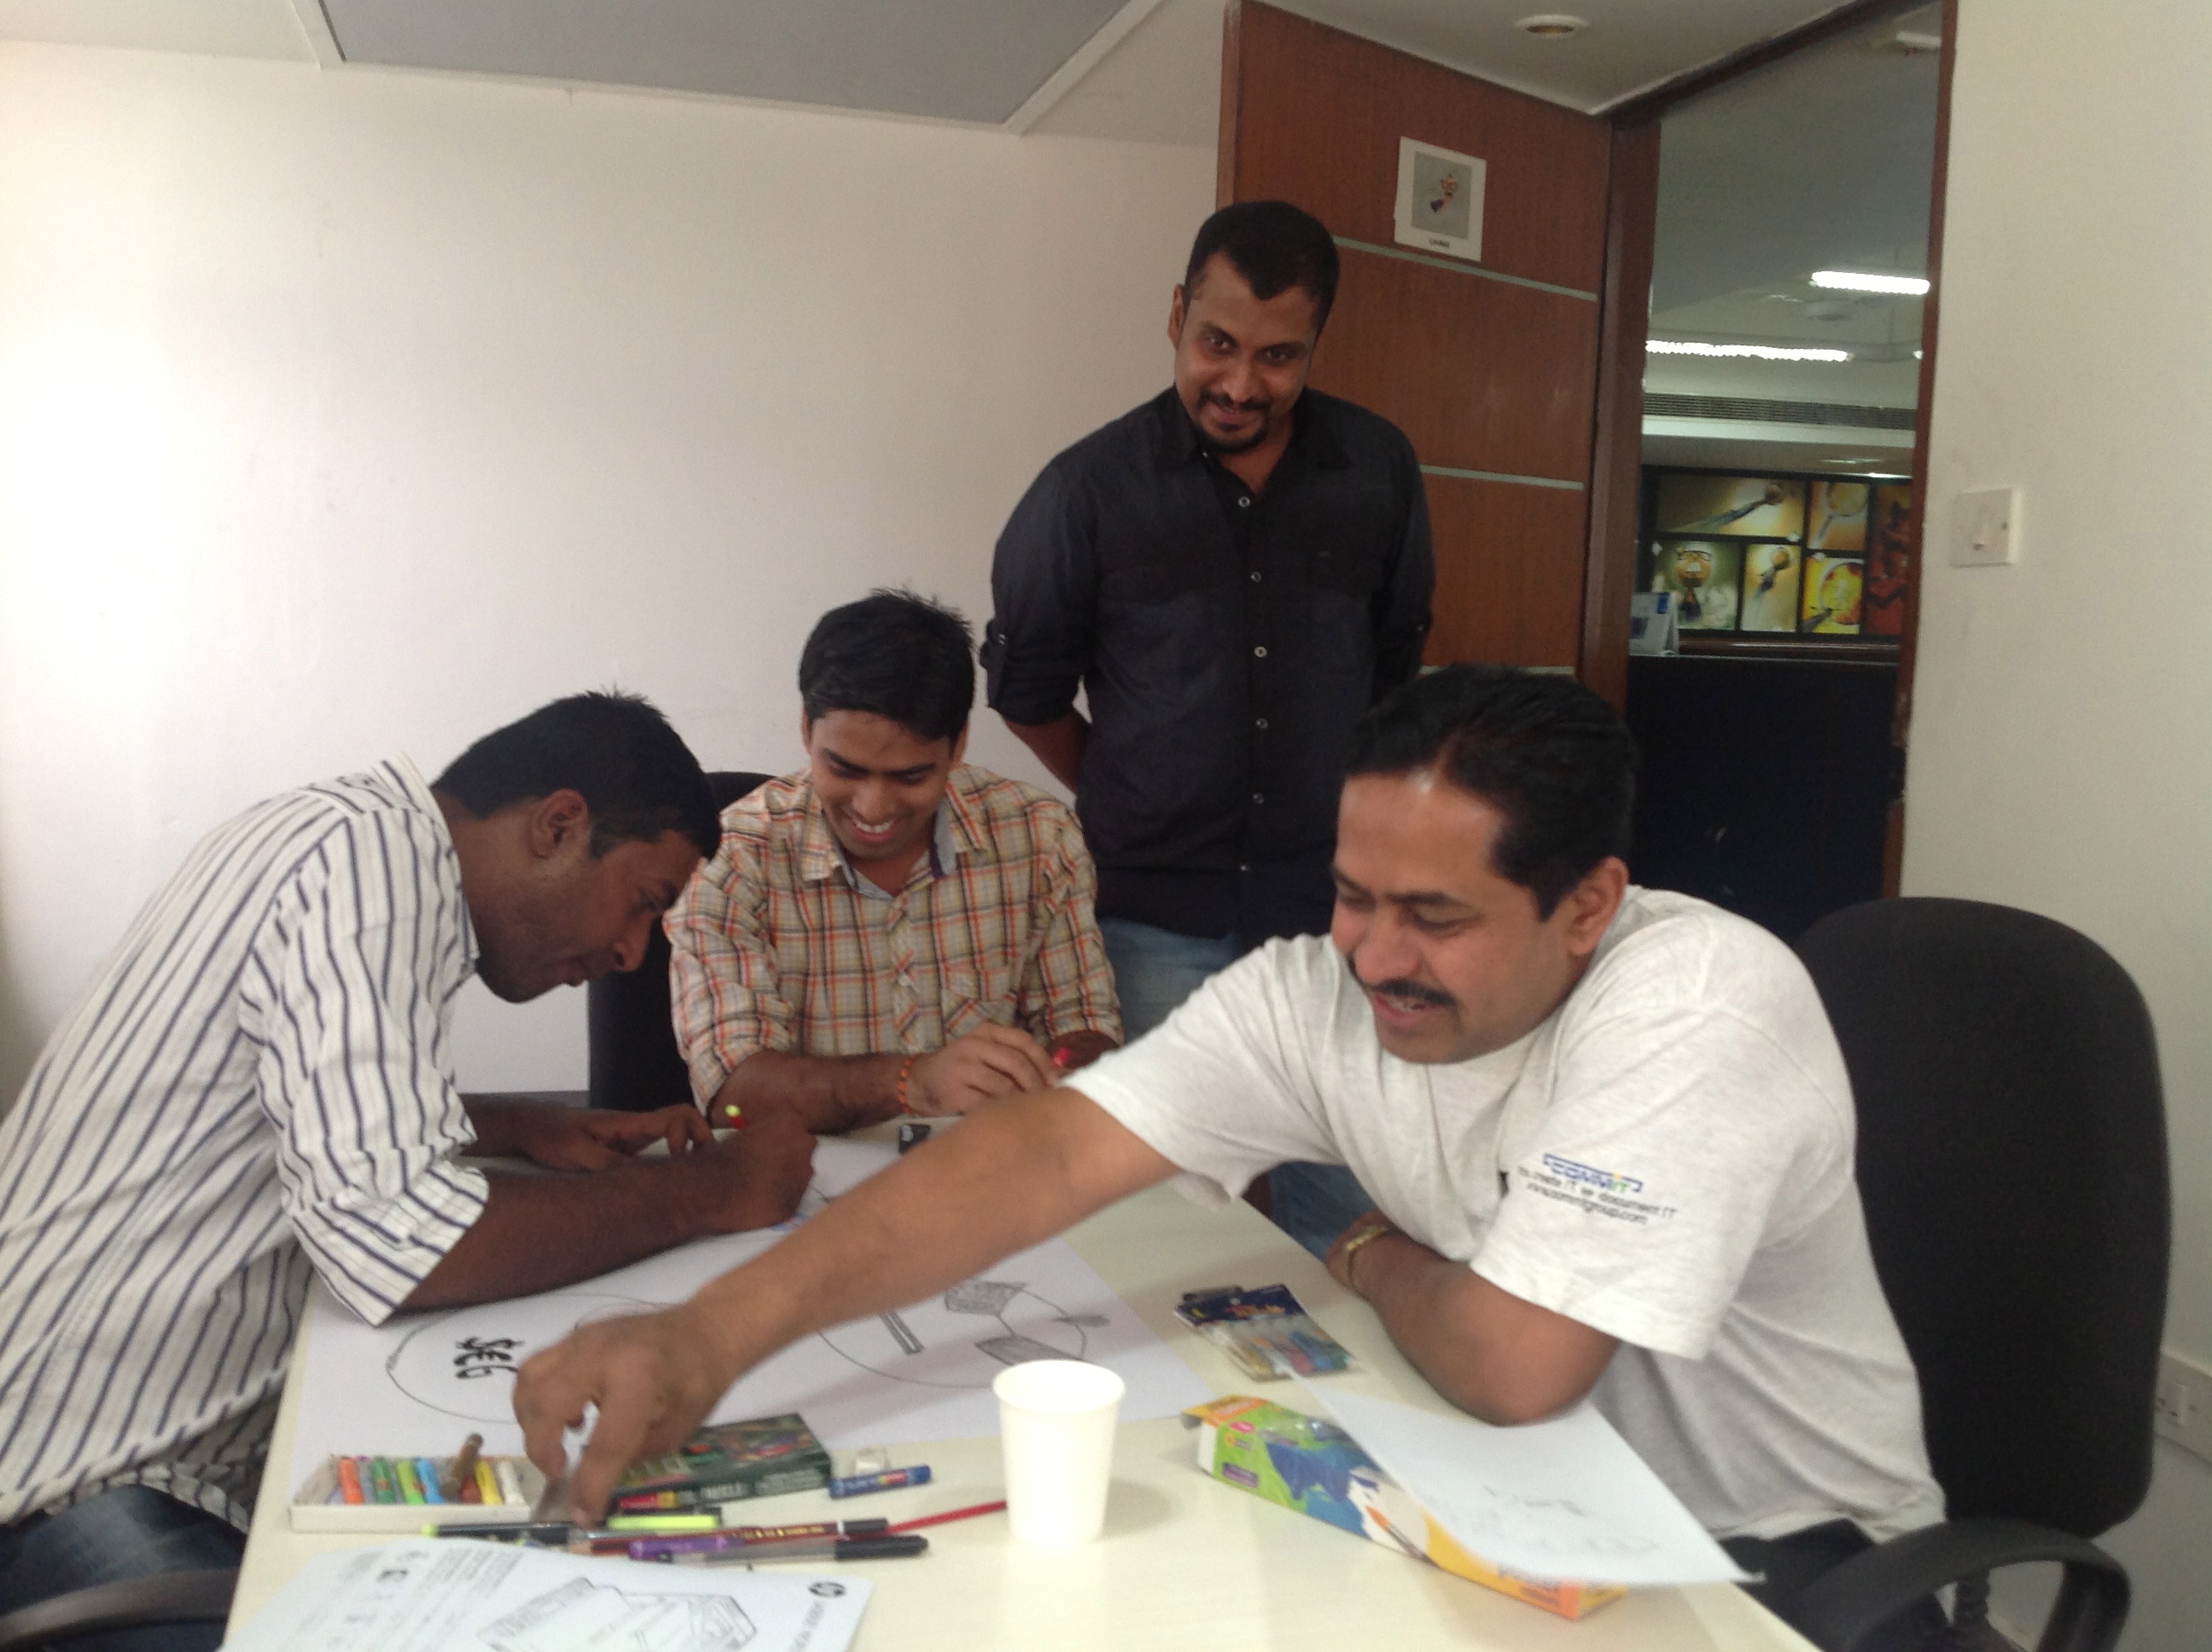
And some competitor espionage
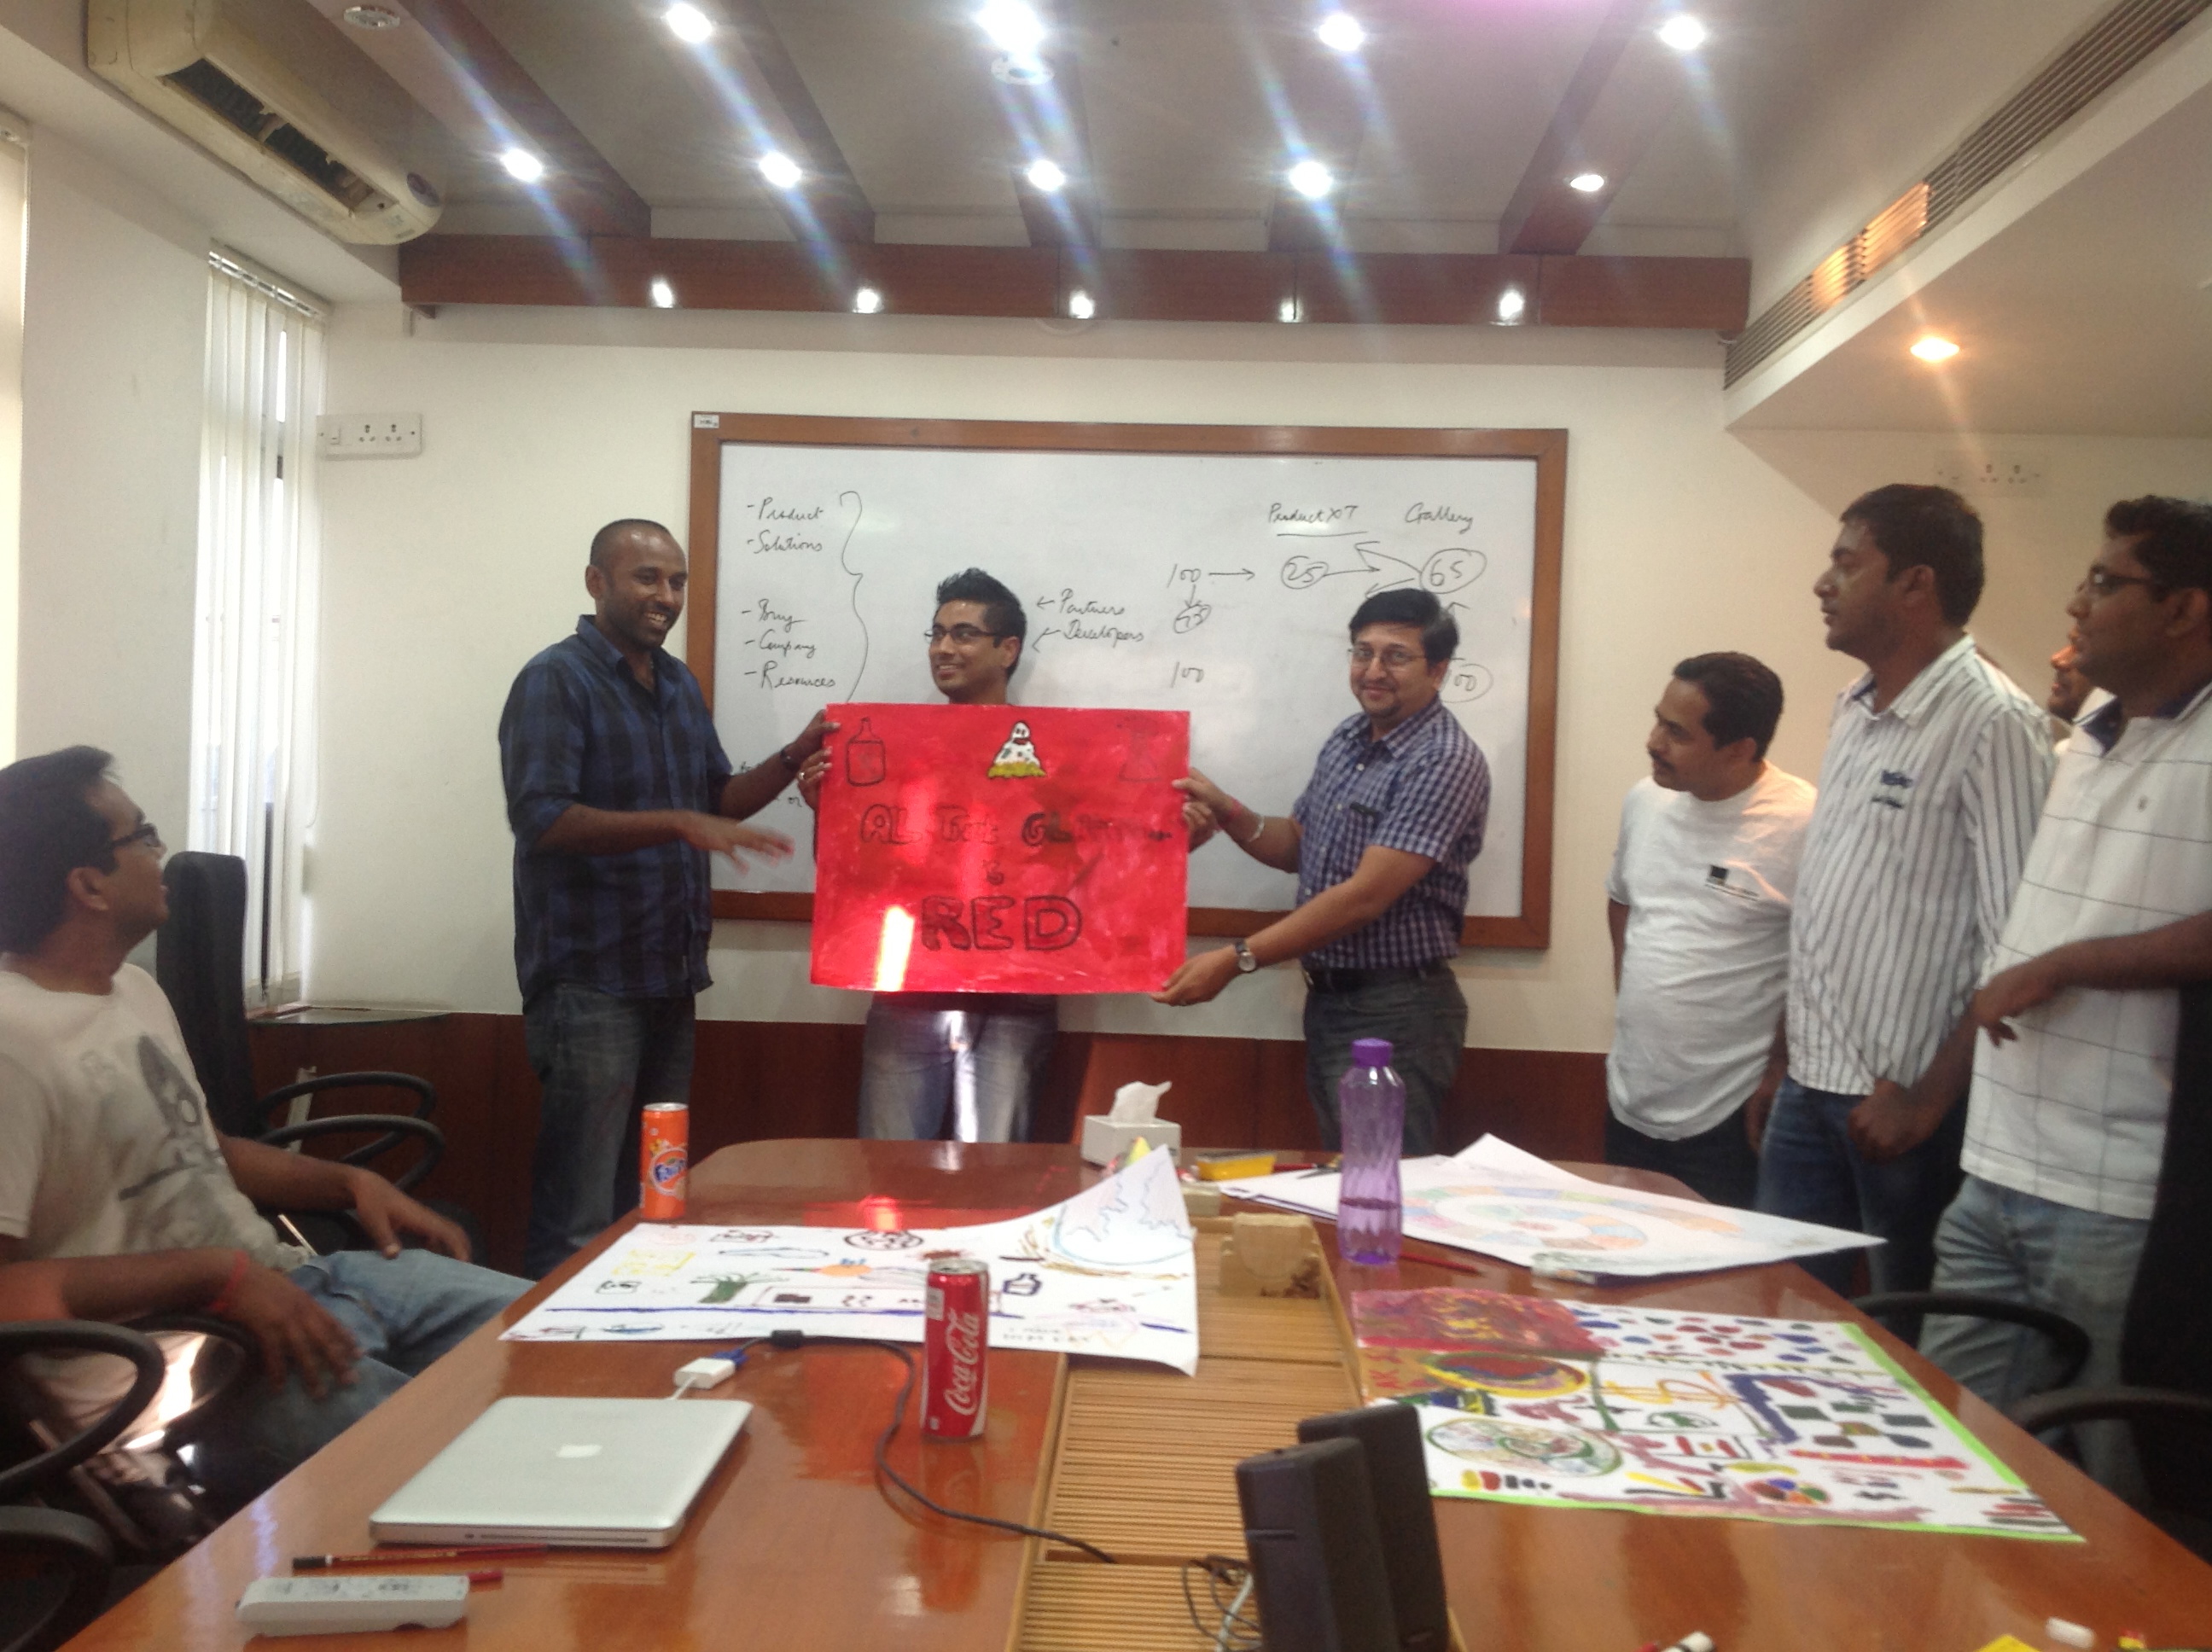
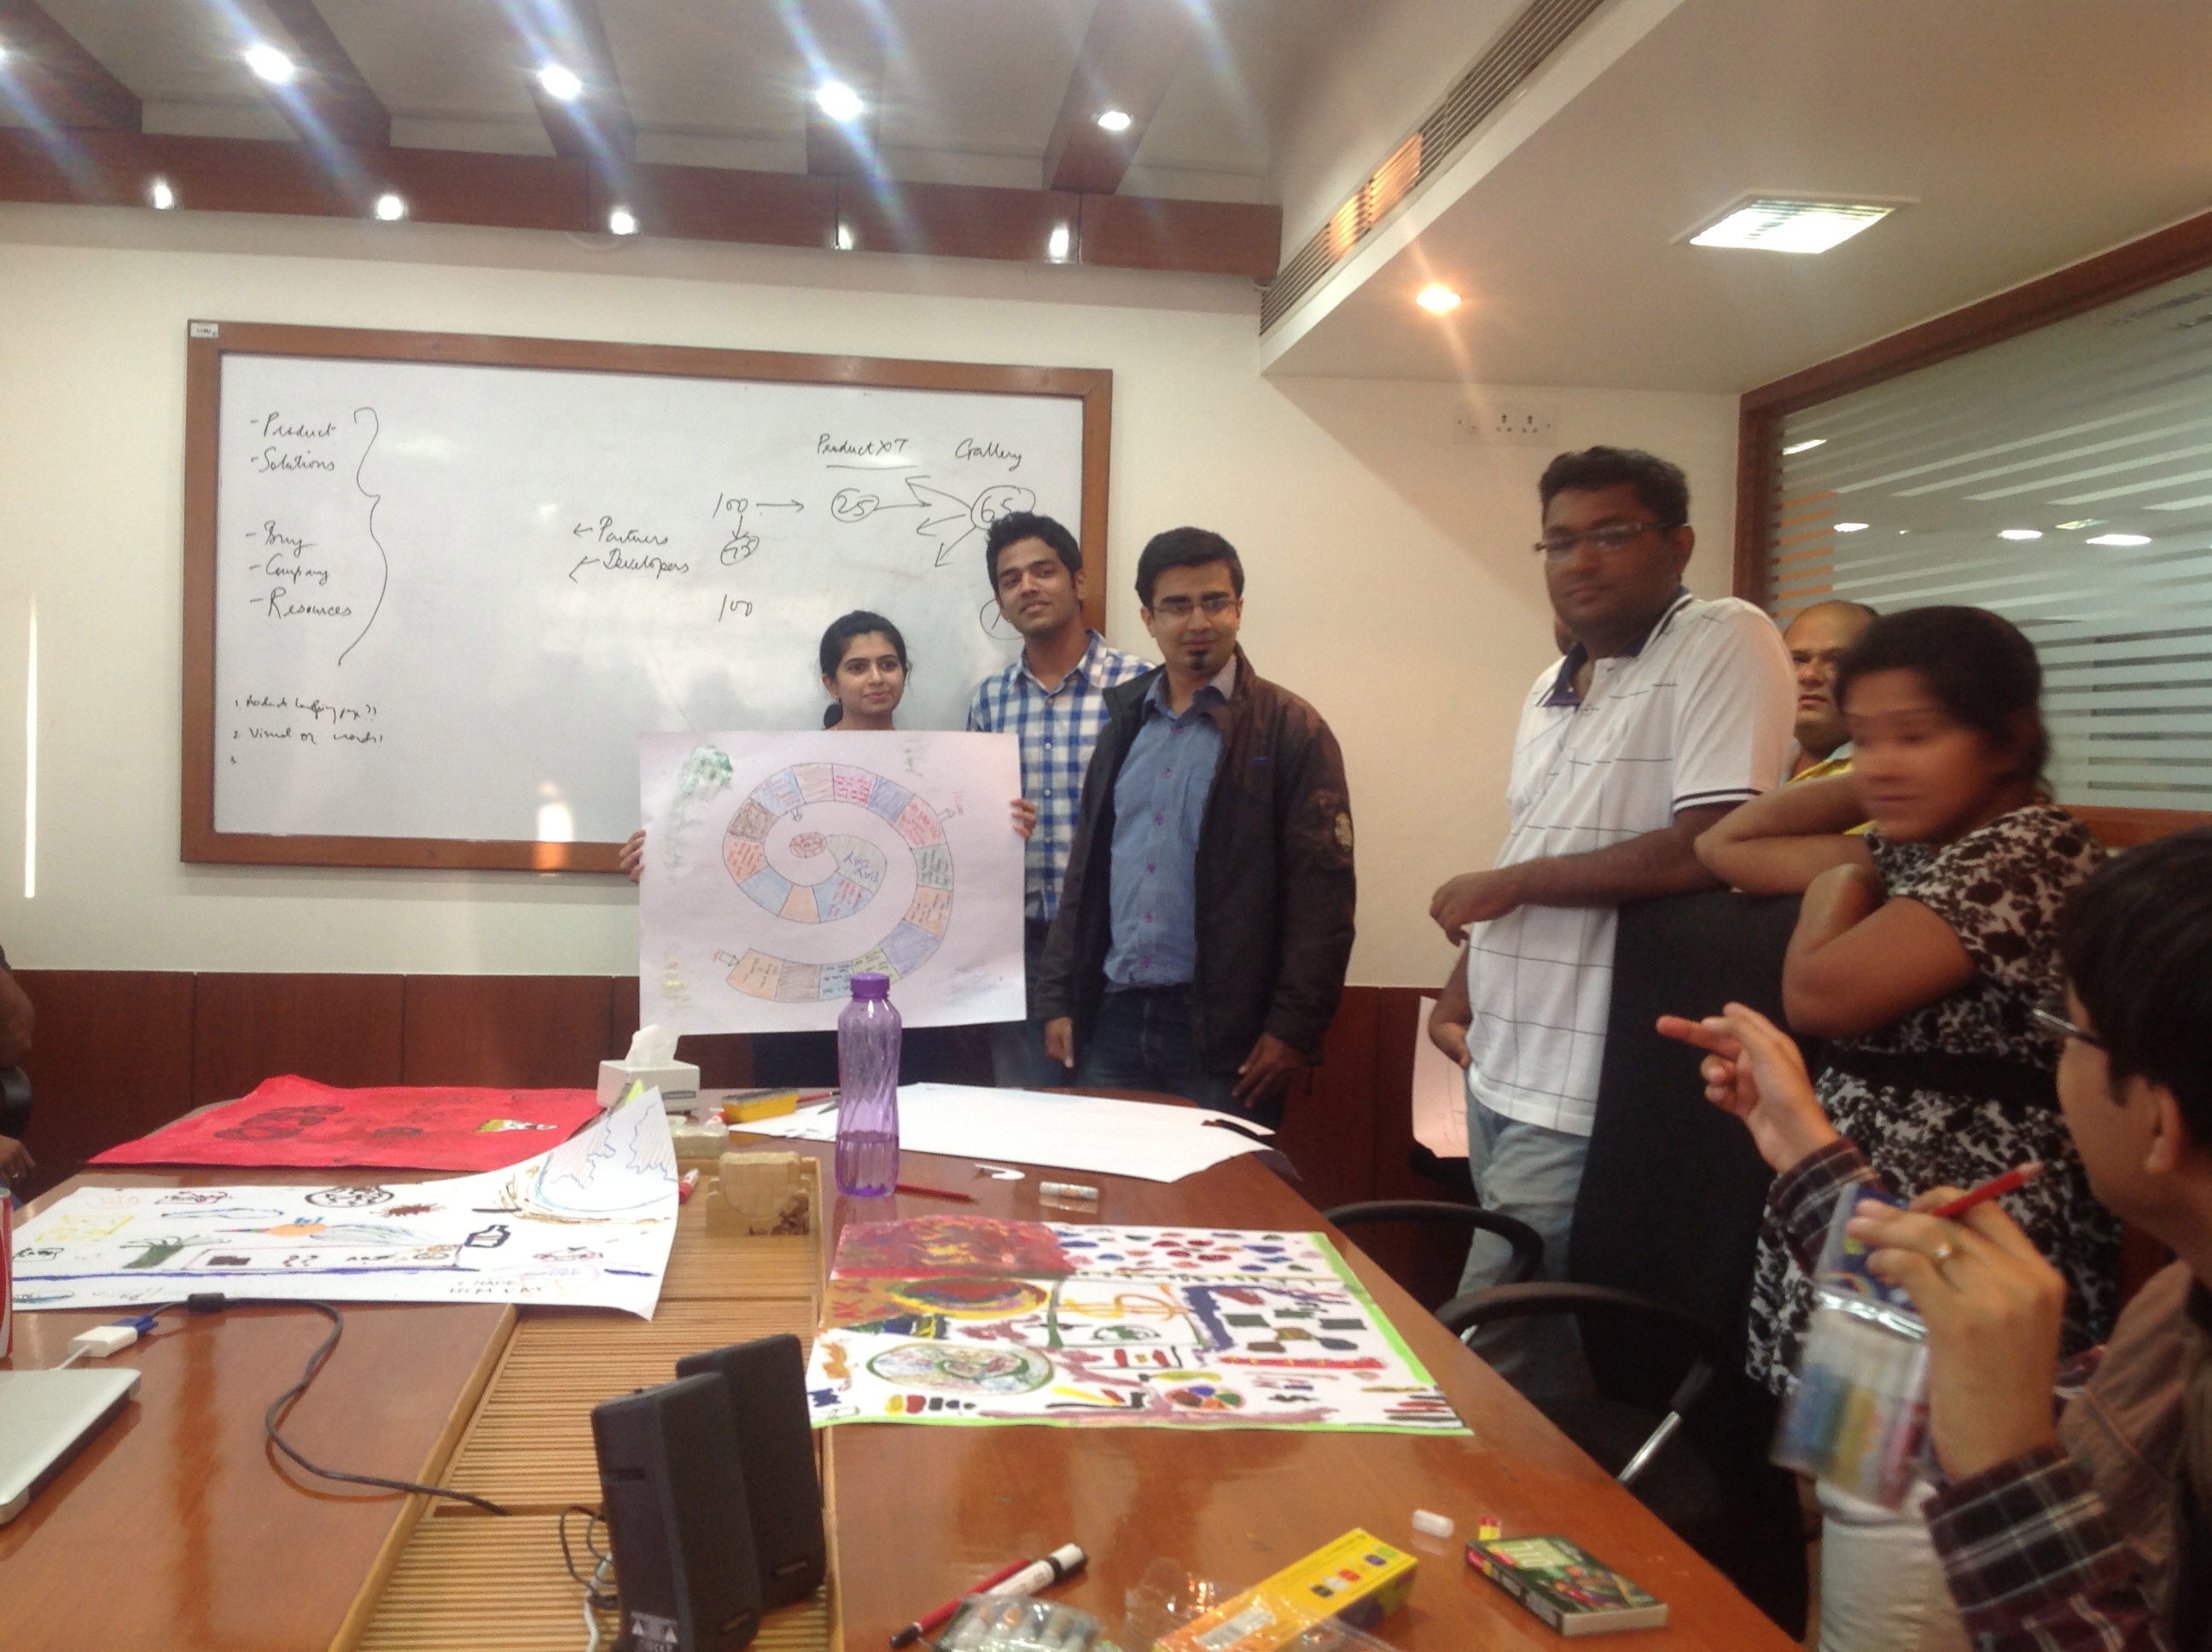
Then came the crucial moment of presenting our masterpieces to the most unbiased people we could find in our office―our security guard and office boy. After all, there was an award (aside: a box of chocolates ;)) to be won. Here are some of the entries:
Gimme RED!
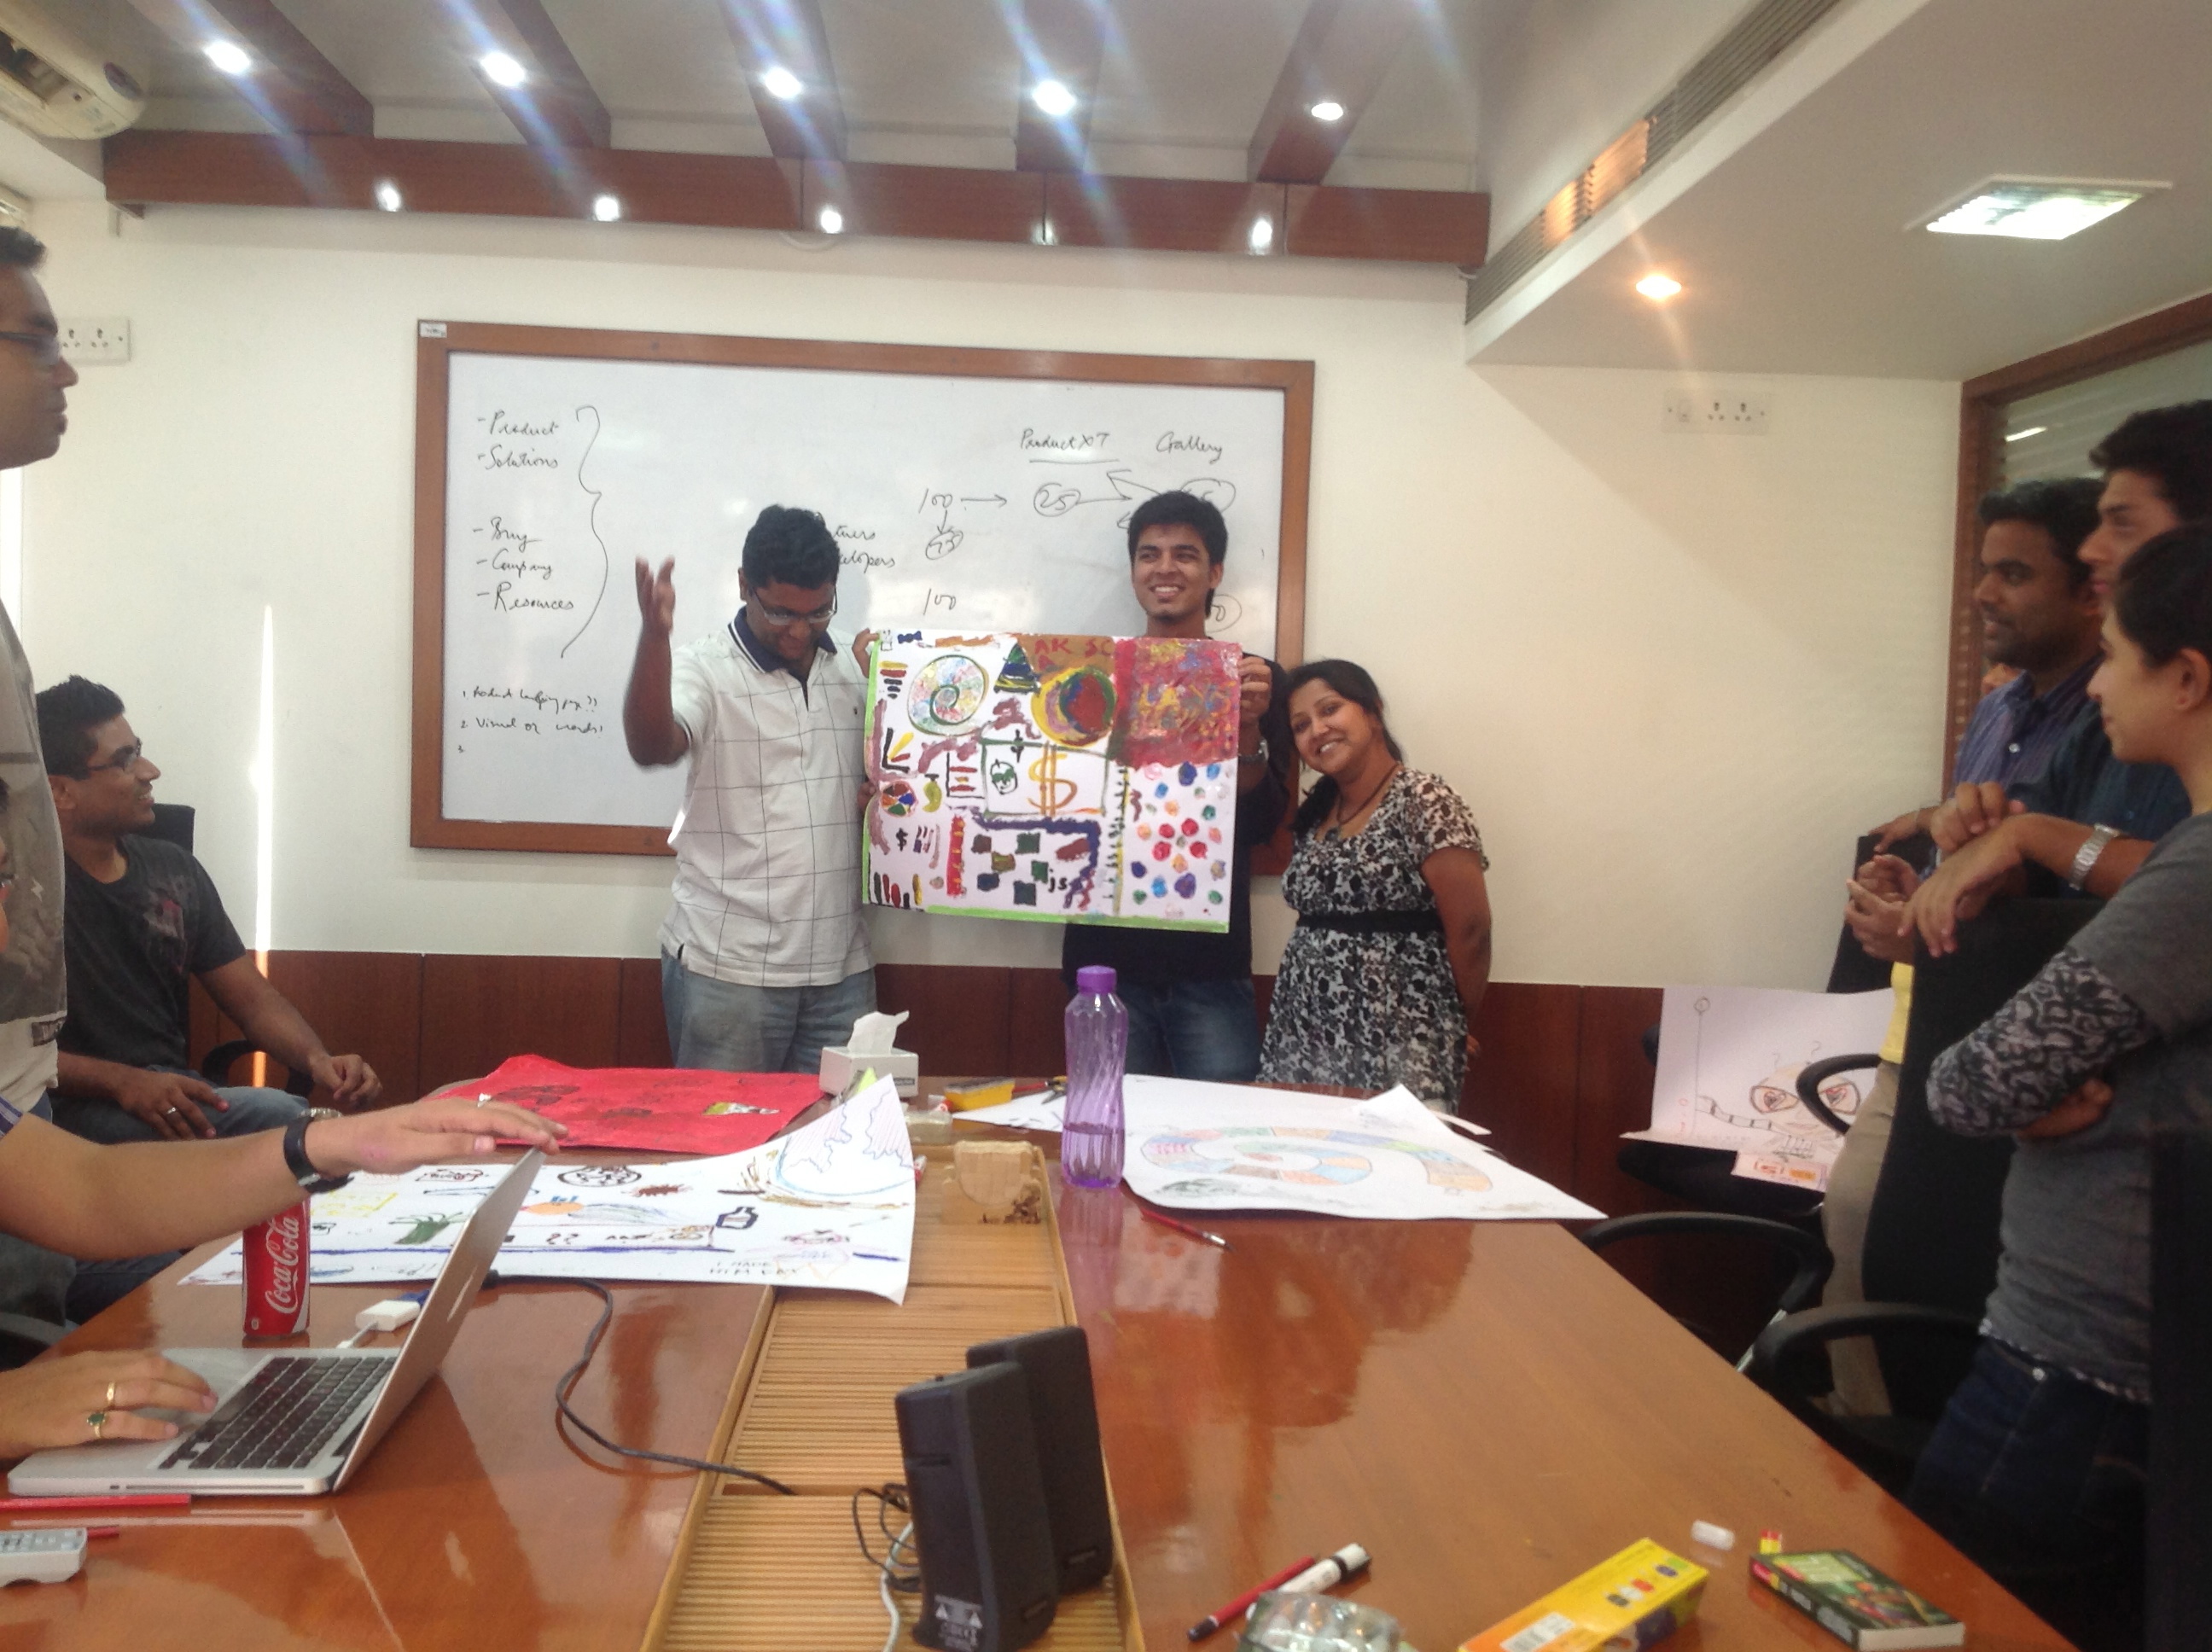
Chart junk, indeed!
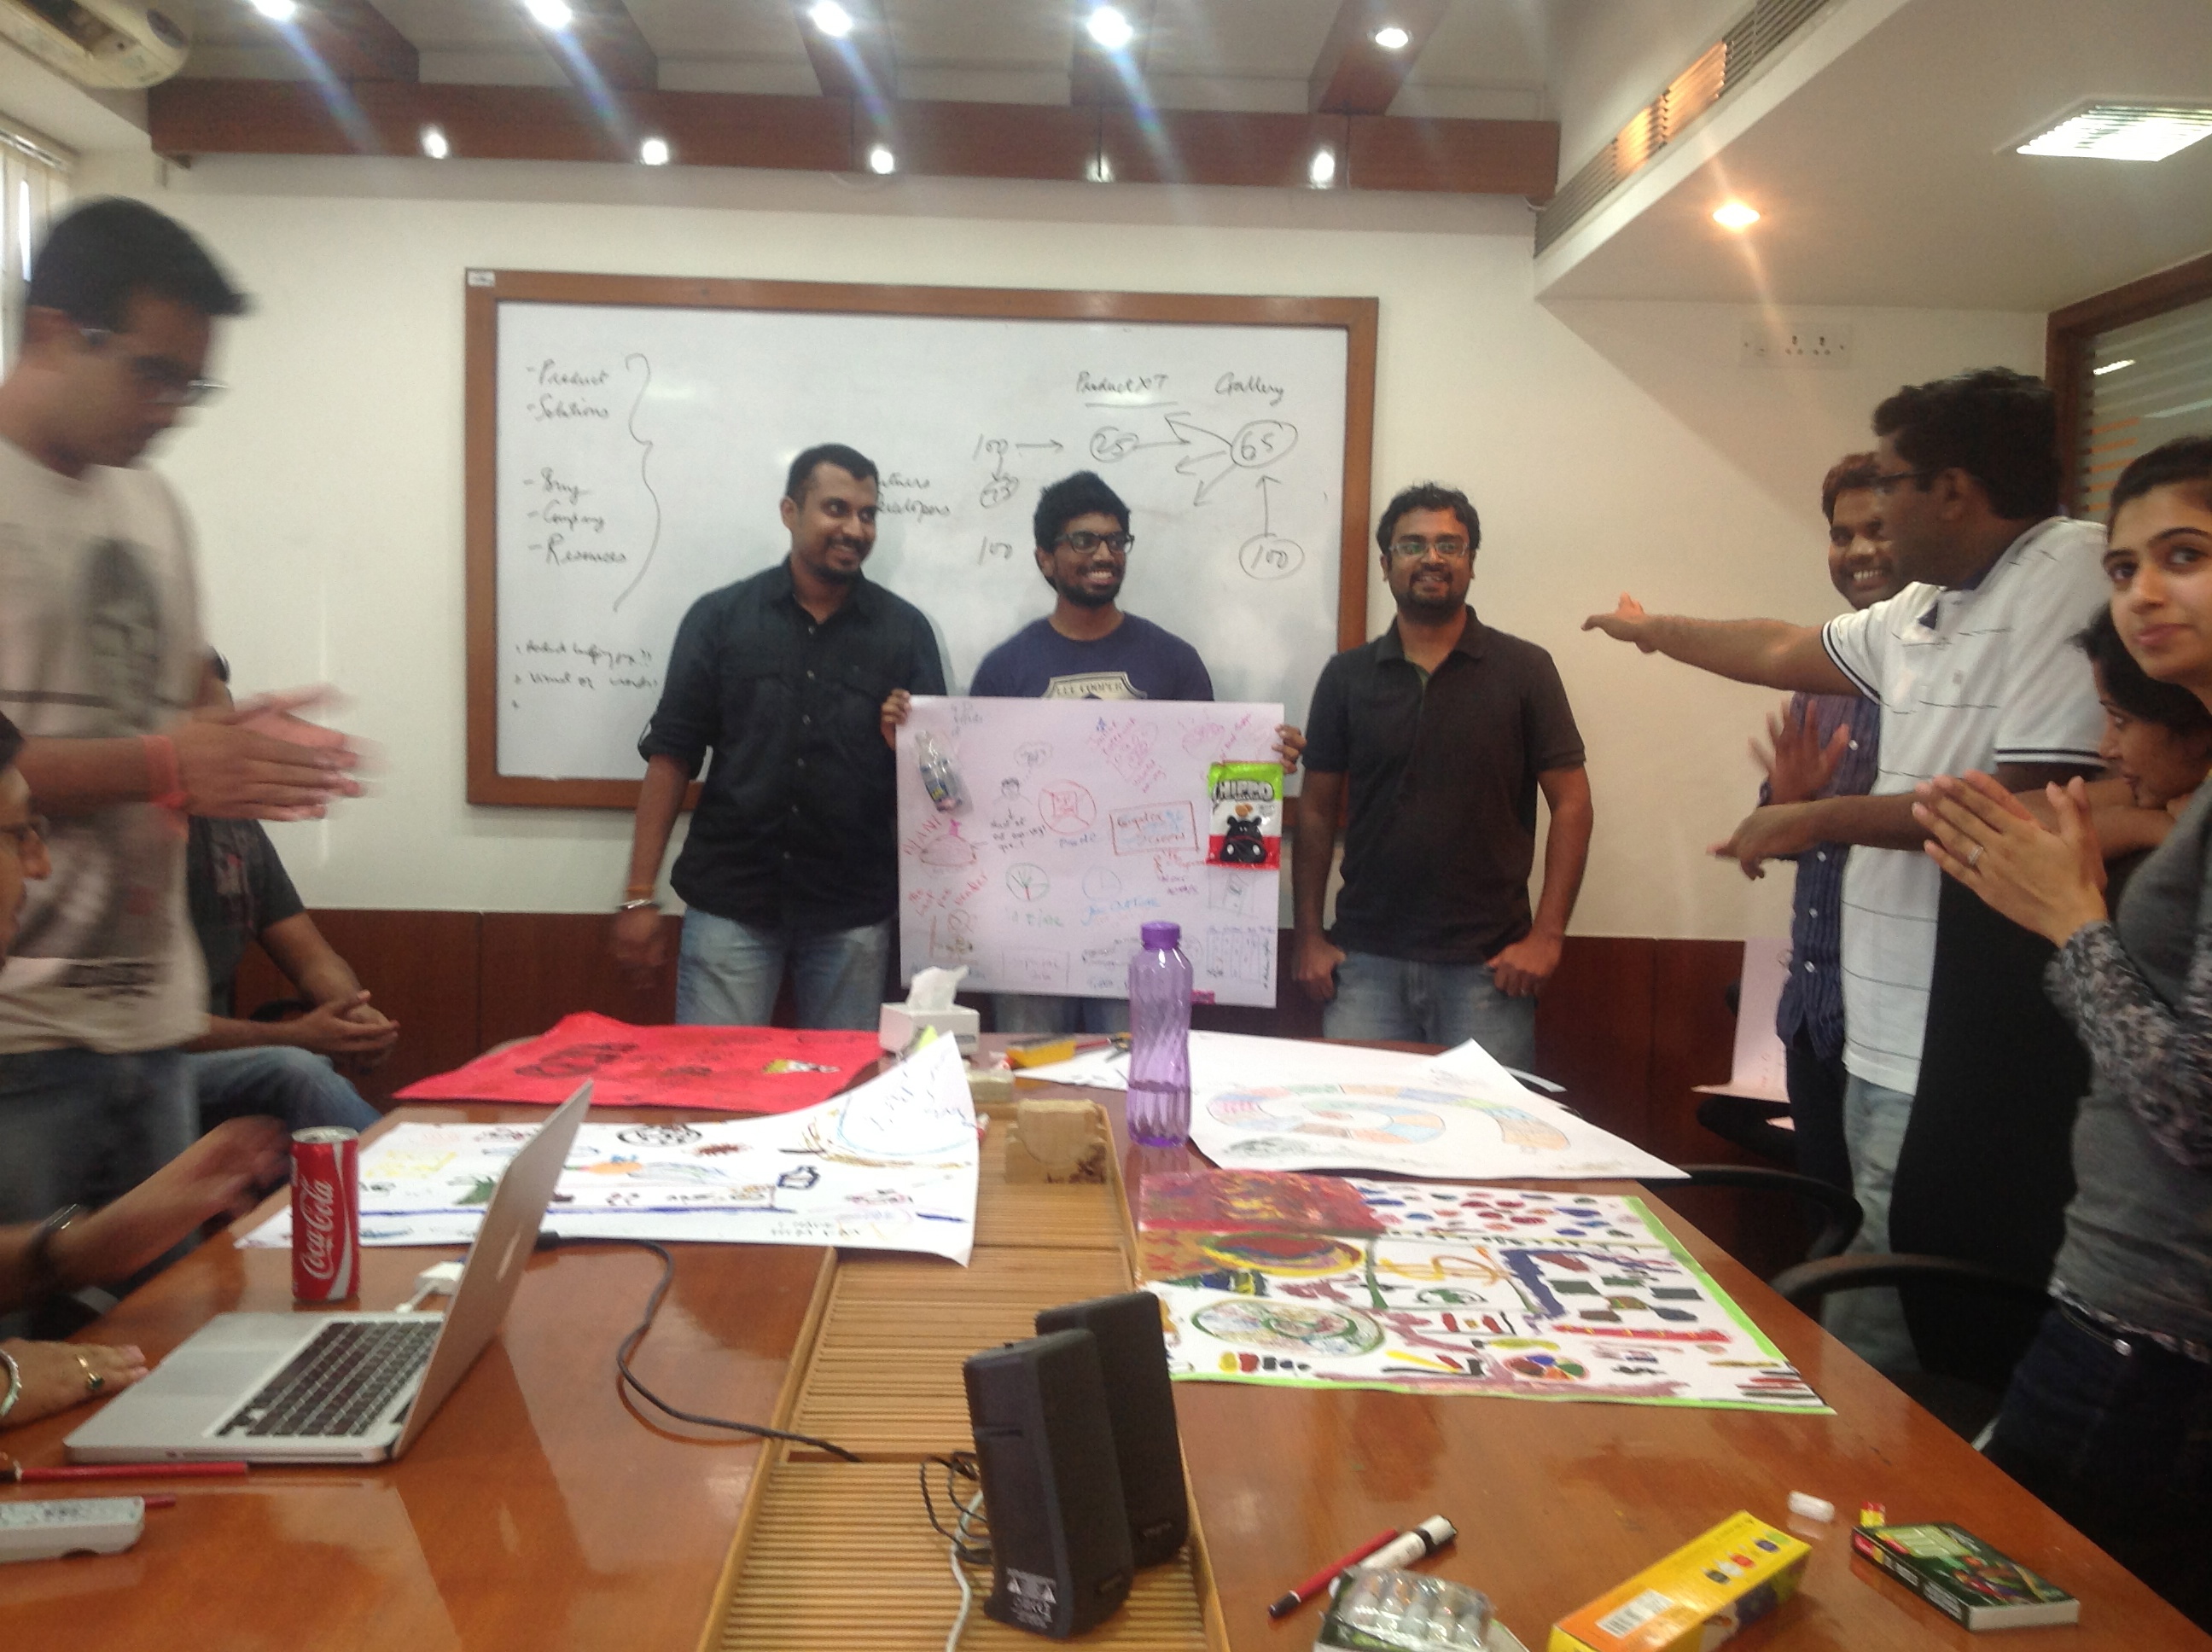
Chips packet + cola bottle + candy wrapper = a recycled 3D experience
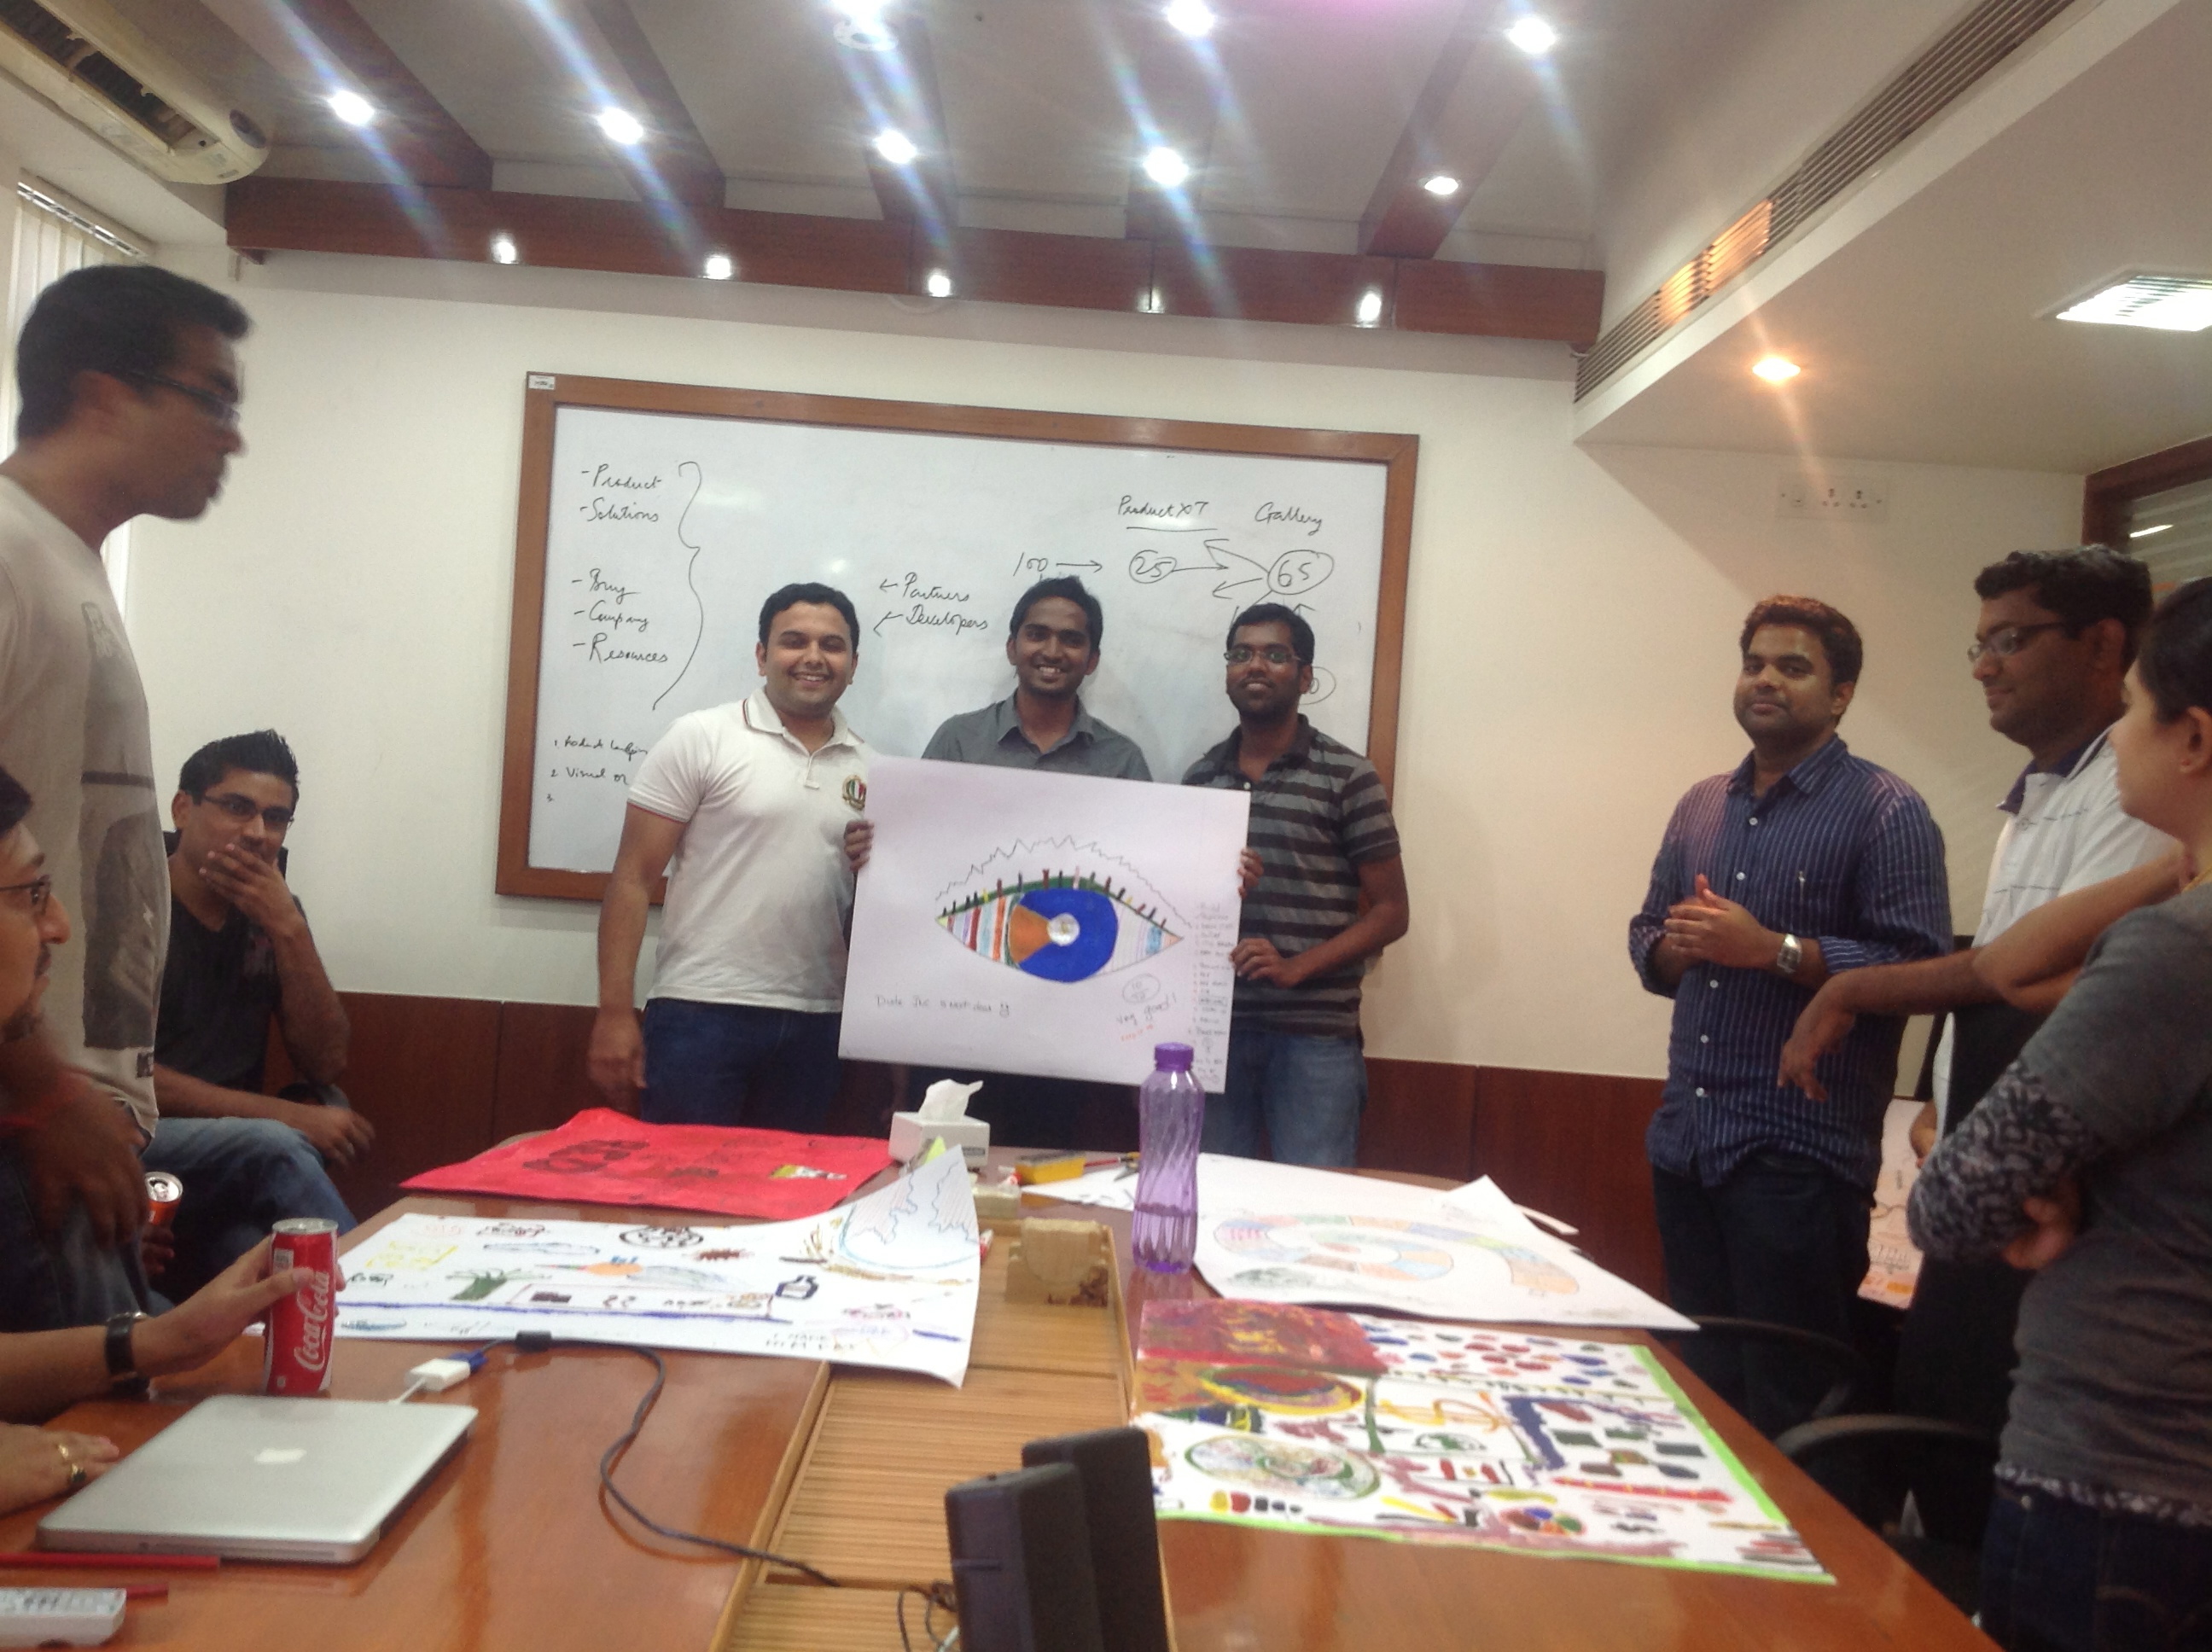
The Eye of Sauron FusionCharts
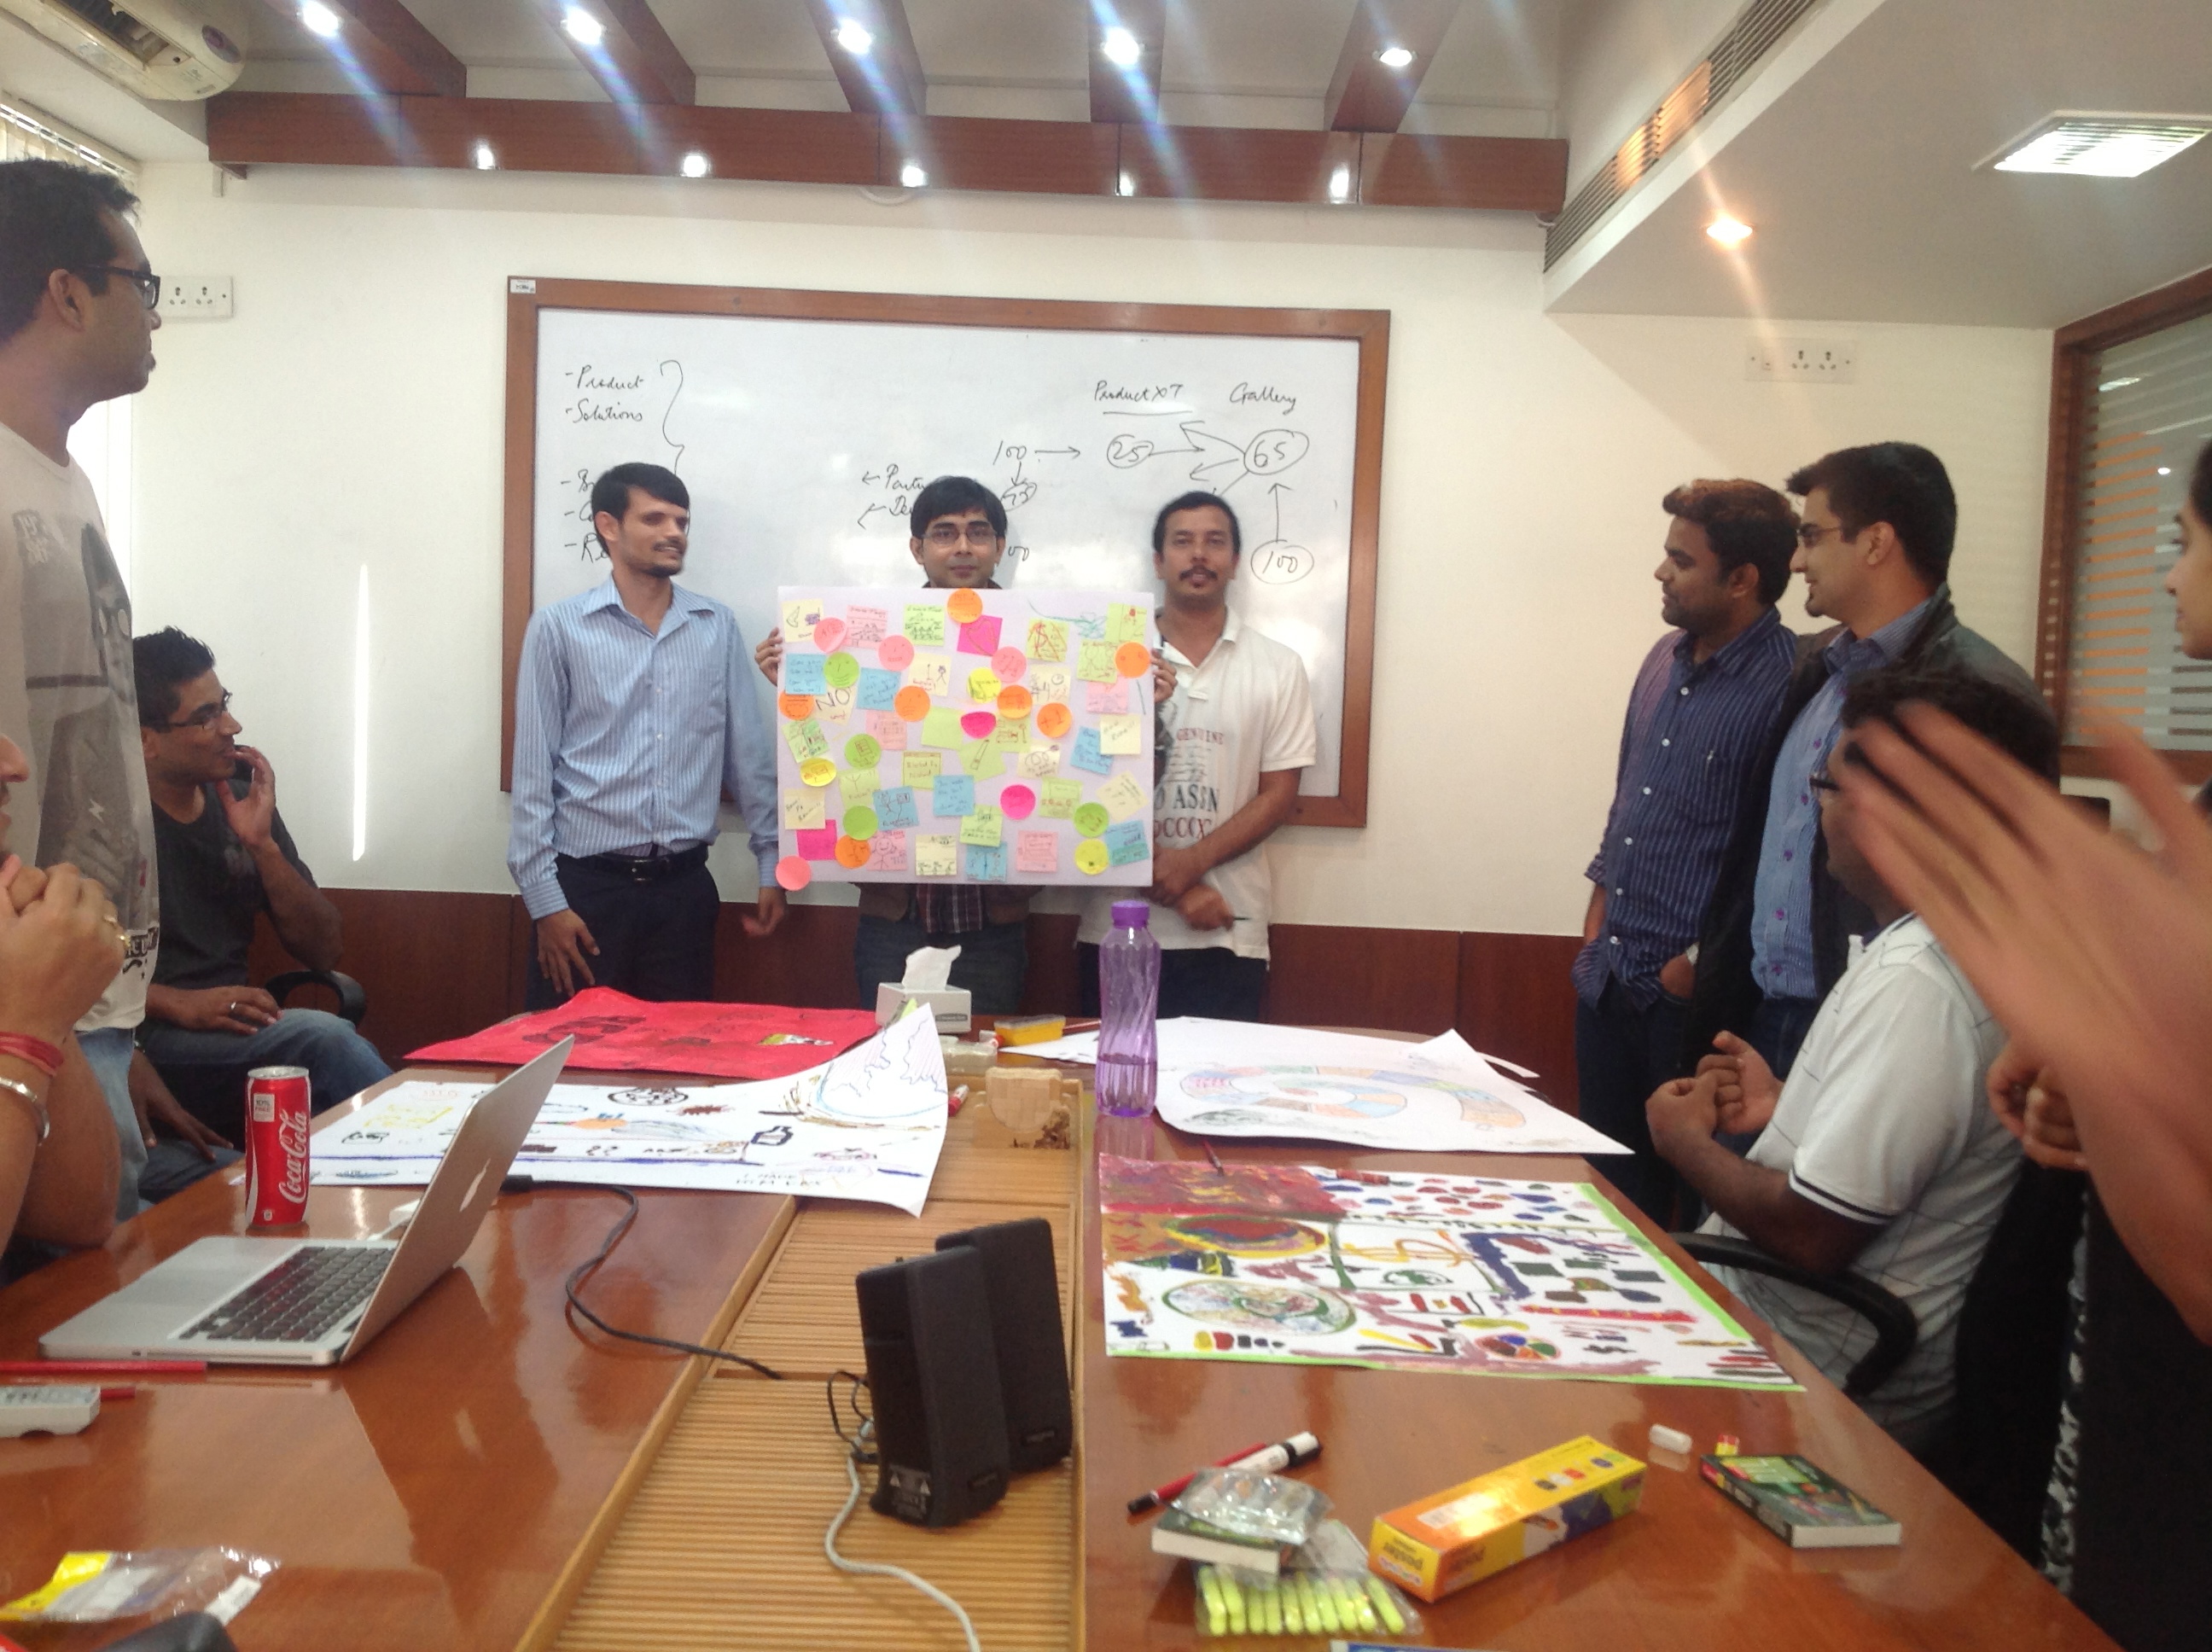
Keep ’em post-ed!
And the winning entry―Snakes and Ladders
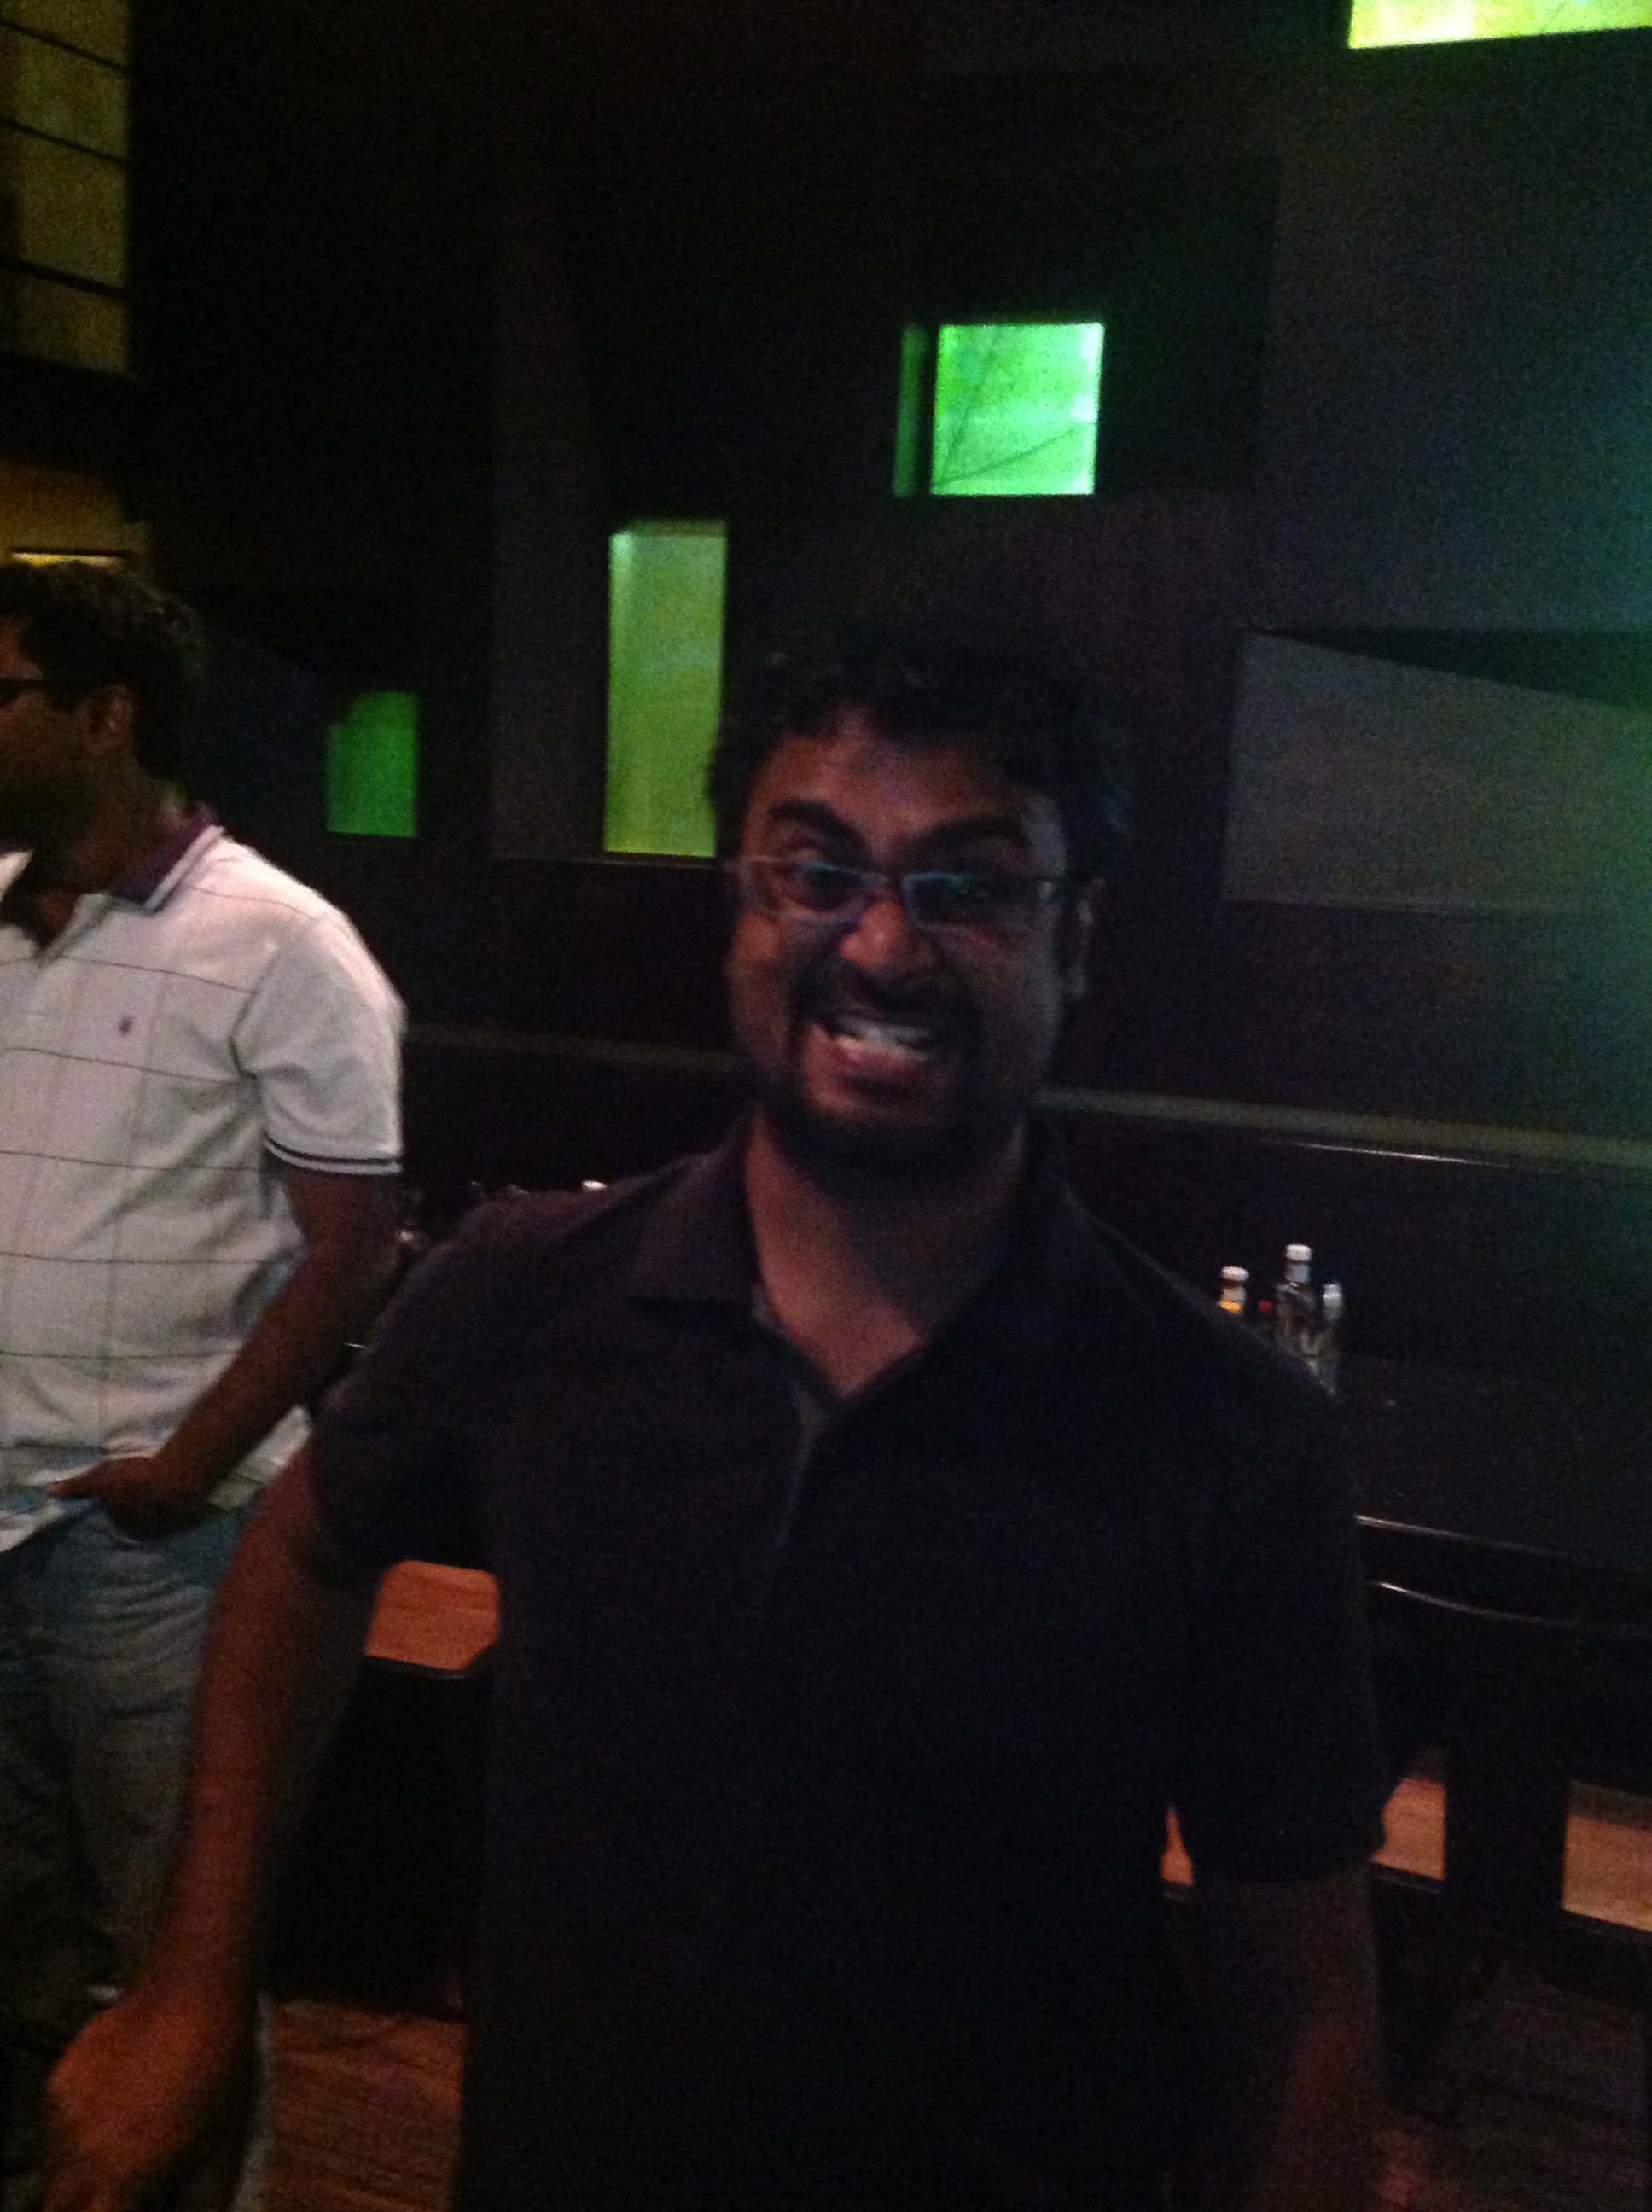
After the hard work, it was time to chill and Tilt, our neighborhood pub, provided us with just the right mix for more fun! Here are some memorable moments captured:
Say cheese!
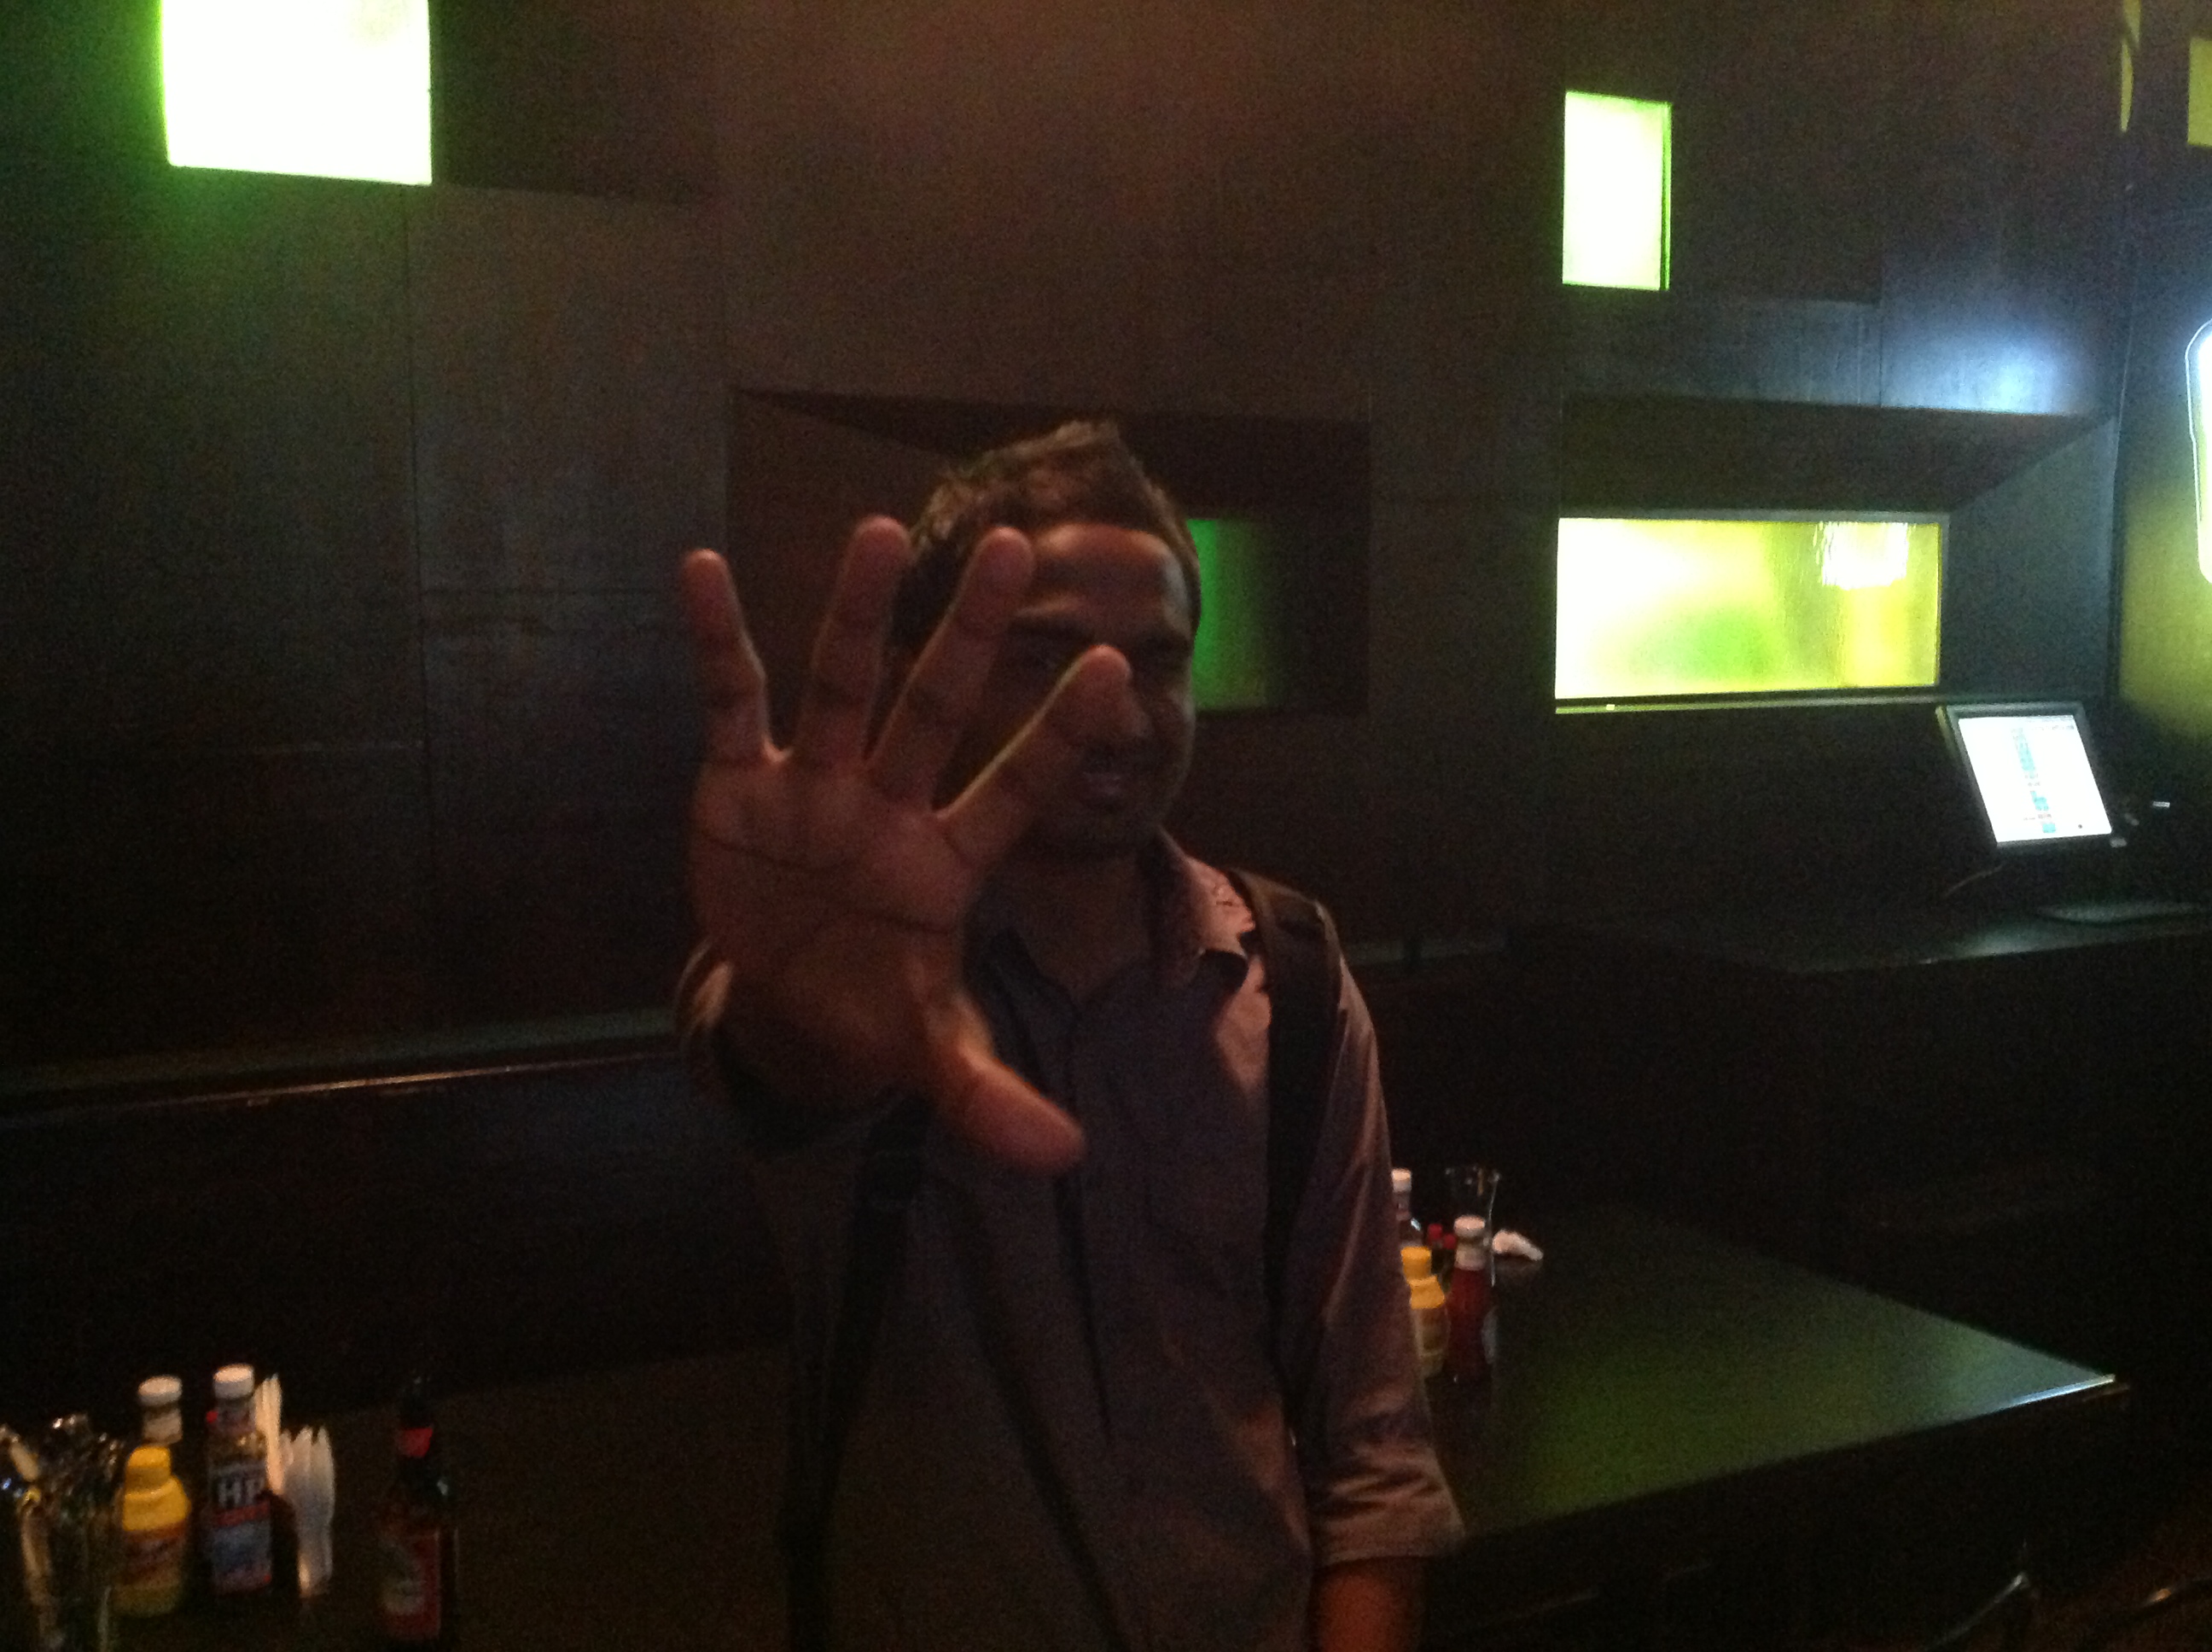
Paparazzi… go away!
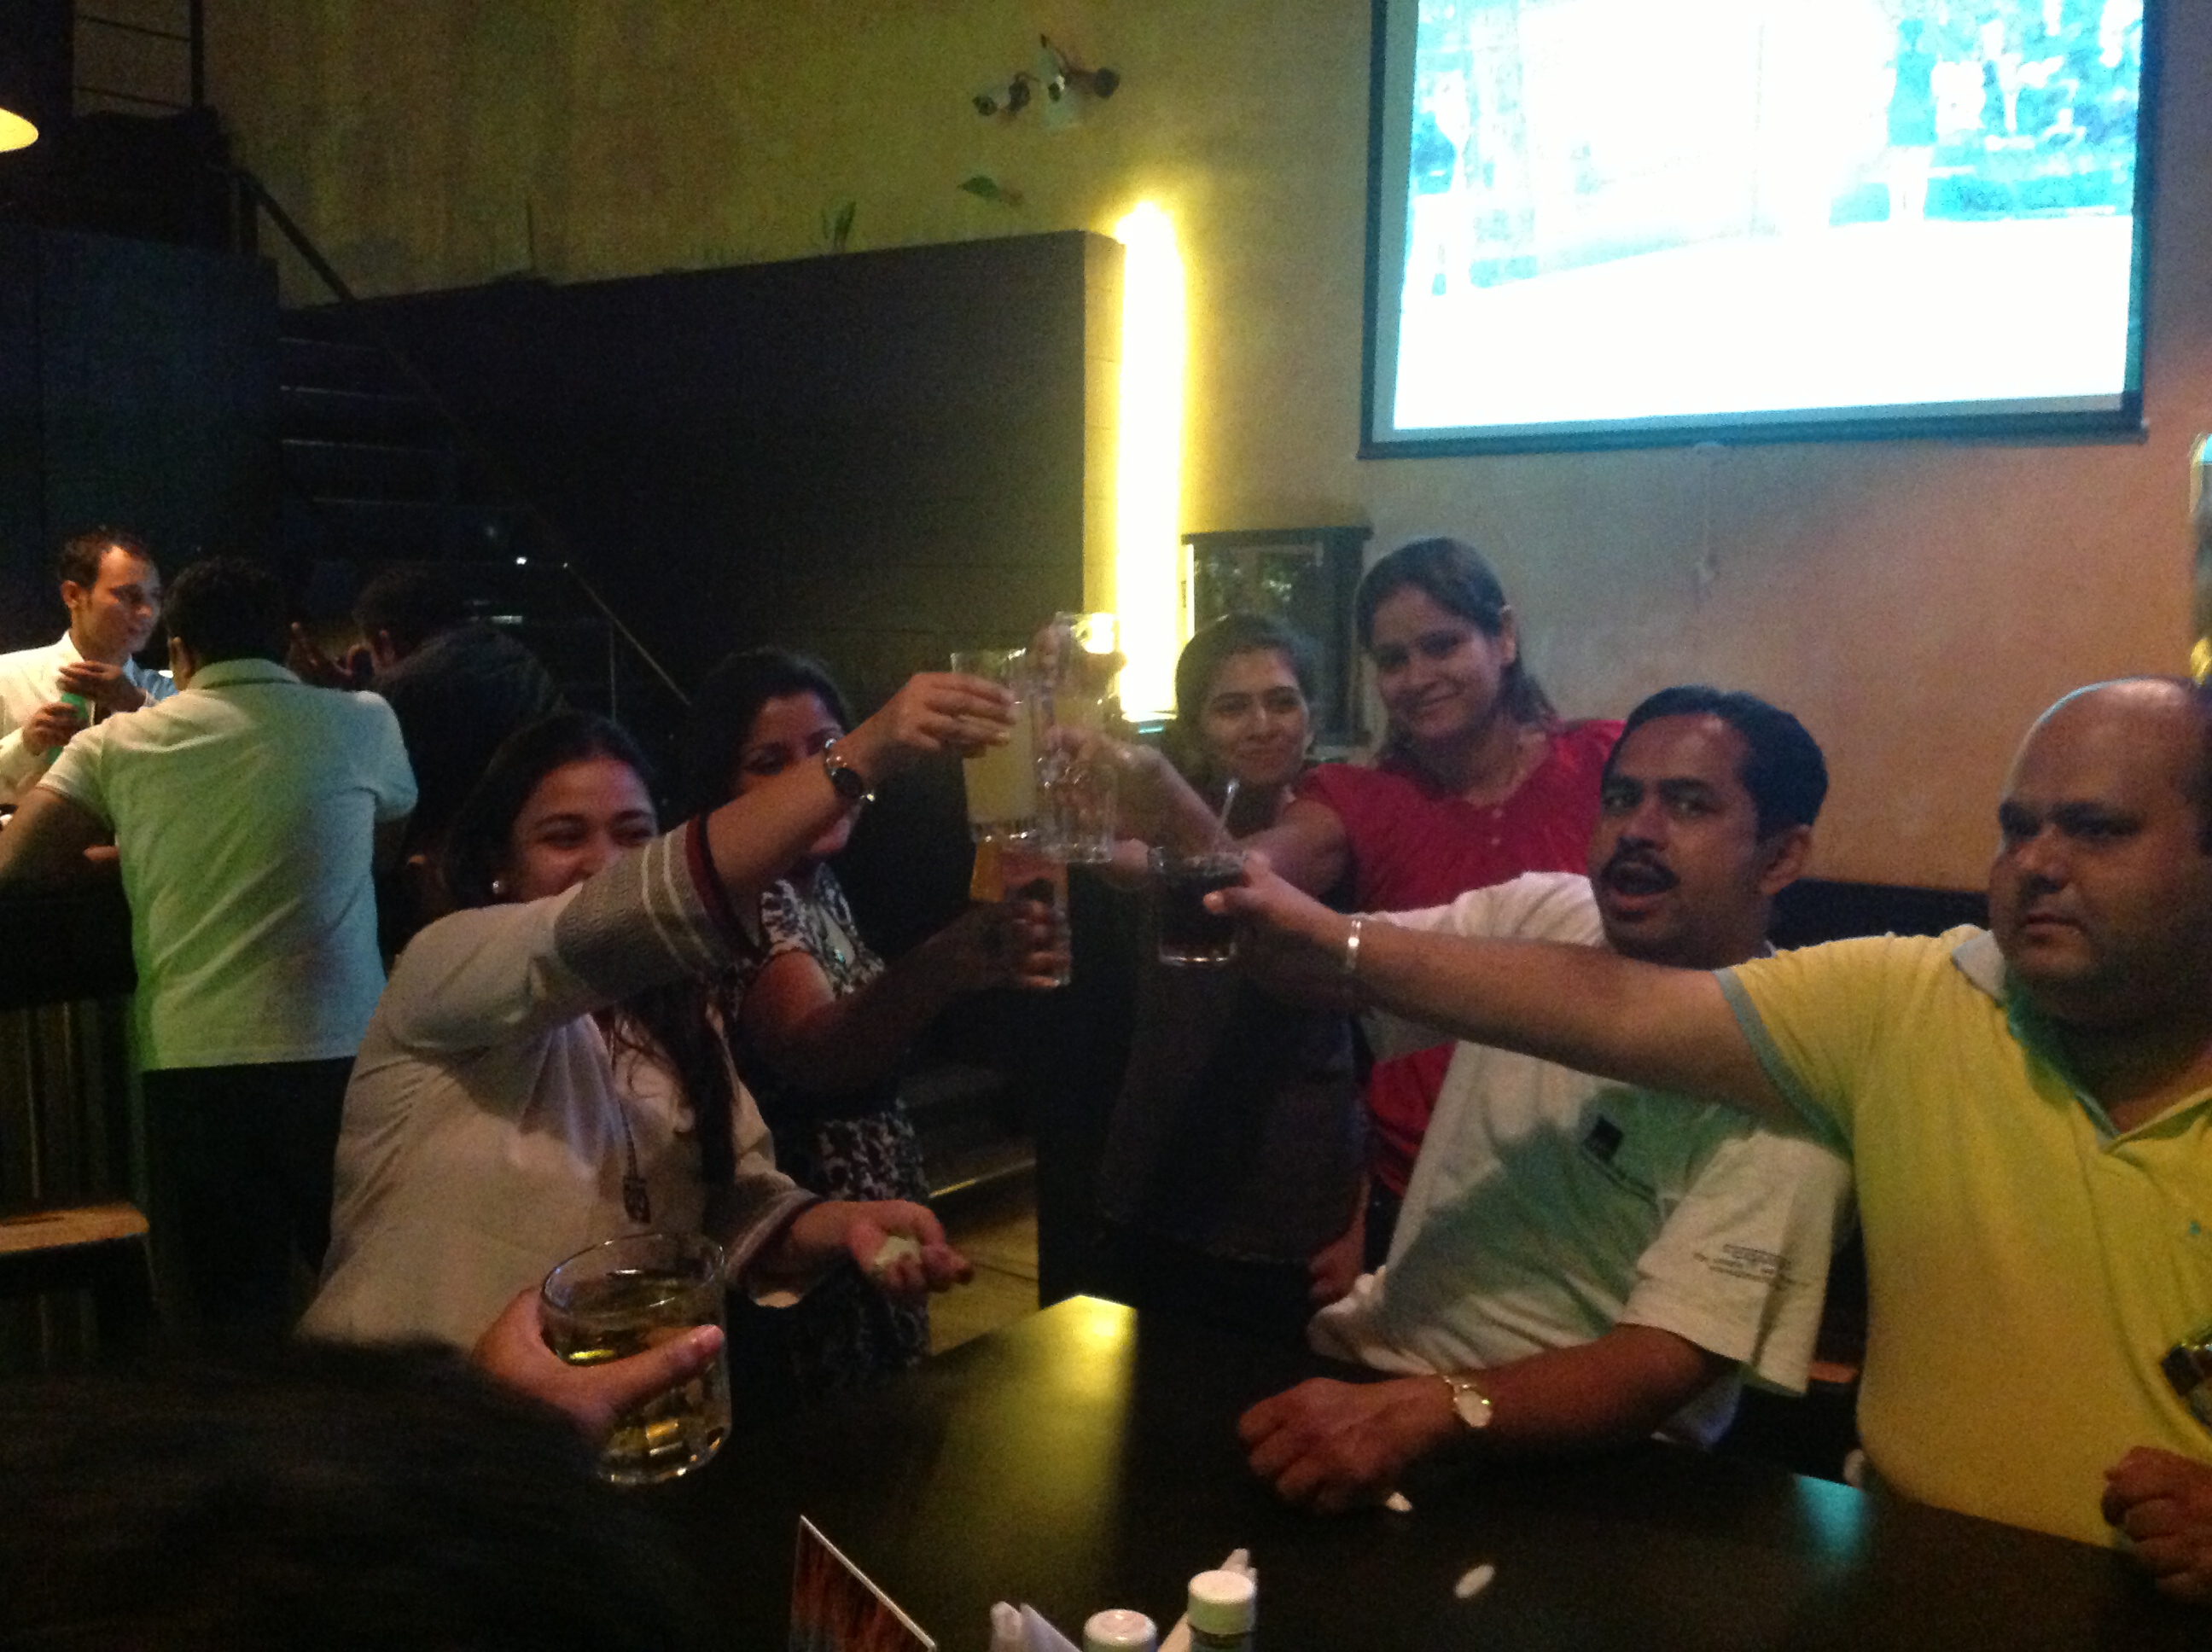
Hic..hic..hooray!
Here’s to the 2 years of craziness and several such years to come!
Want to be a part of this madness and fun? Quick, head to our Careers page to find a suitable opening for yourself!
You can build complex web applications easily with Angular. But it’s a challenge to present…
JavaScript charts help transform raw data into clear, interactive visualizations that users can easily understand.…
Modern web applications depend on data visualization to transform complex information into clear, actionable insights.…
Data is a big part of modern software. Companies use charts to track sales, monitor…
Every day, businesses get more data than ever before. Looking at endless rows and columns…
Building interactive React charts from scratch can quickly become complicated. It becomes even more challenging…
View Comments
Congratulations. Many more years to come. All the best :-)
Thank you Sachin!