Table of Contents
npm install aurelia-cli -g After the installation, create the skeleton of the application. Run the following code in cmd shell to create the skeleton : au start The above command will install all the dependencies to run a basic project. Install FusionCharts library by running the following command on the terminal. npm install fusioncharts To know more about how to install FusionCharts via npm check here. aurelia.json file. In this file, search for a prepend array of objects and add node_modules path to it. Refer to the code snippet below: "prepend": [
"node_modules/bluebird/js/browser/bluebird.core.js",
{
"path": "node_modules/aurelia-cli/lib/resources/scripts/configure-bluebird-no-long-stacktraces.js",
"env": "stage & prod"
},
{
"path": "node_modules/aurelia-cli/lib/resources/scripts/configure-bluebird.js",
"env": "dev"
},
"node_modules/requirejs/require.js",
"node_modules/fusioncharts/fusioncharts.js",
"node_modules/fusioncharts/fusioncharts.charts.js"
]
Import FusionCharts library files in your project. To do this, browse app.js file located inside the src folder of your project and add the following lines to it: import {FC} from 'node_modules/fusioncharts/fusioncharts.js';
import {Charts} from 'node_modules/fusioncharts/fusioncharts.charts.js';
Now, create a datasource object and place them inside the FusionCharts constructor method. To do so, implement the Aurelia’s attached method of the component lifecycle. To know more about Aurelia’s component life cycle, click here. Refer to the following code snippet. attached(){
let mydata={
"chart": {
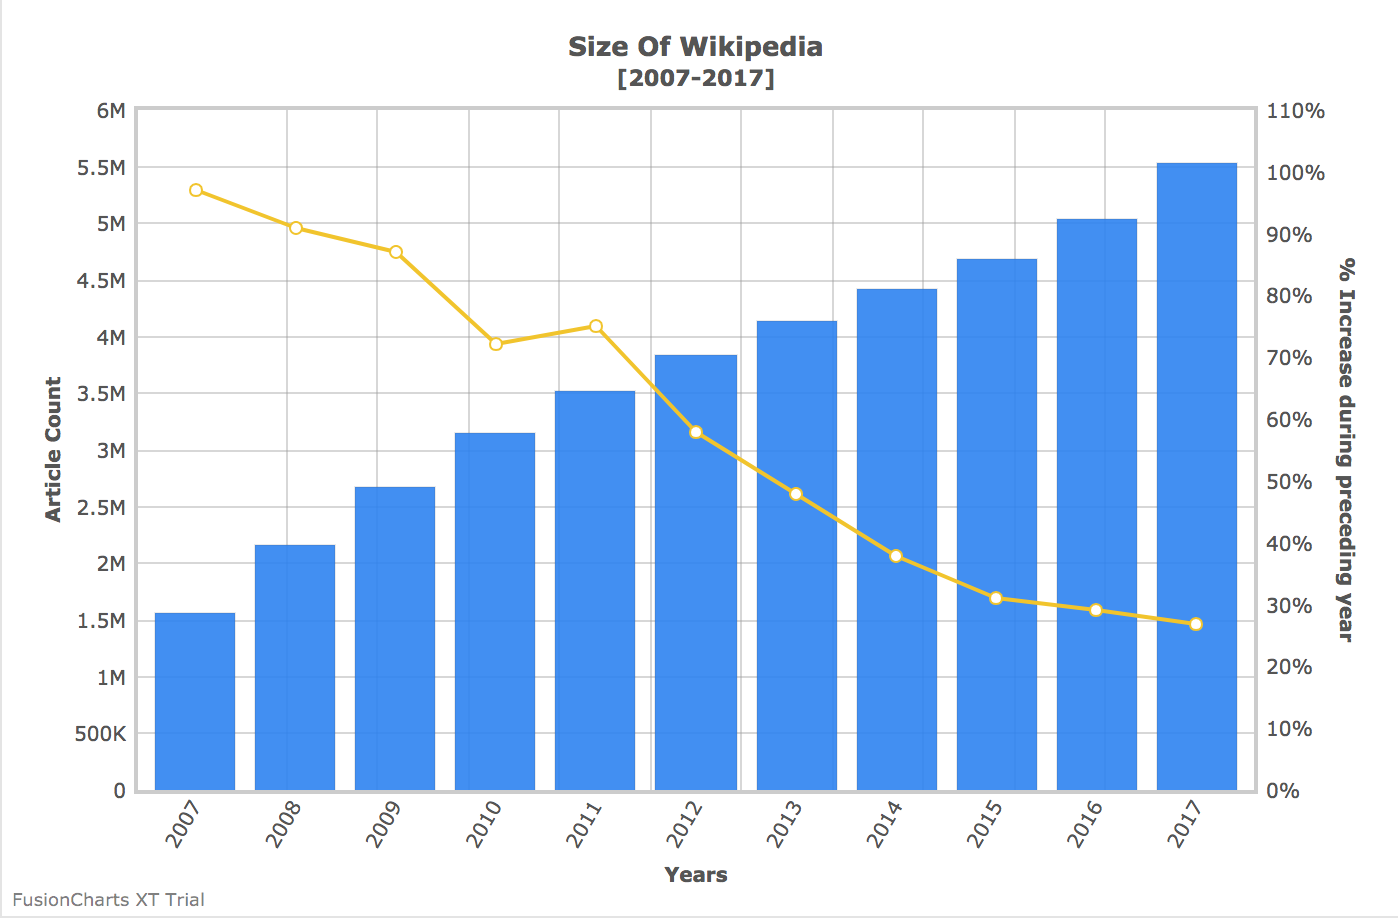
"caption": "Size Of Wikipedia",
"subcaption": "[2007-2017]",
"pYAxisName": "Article Count",
"xAxisName": "Years",
"sYAxisName": "% Increase during preceding year",
"sNumberSuffix": "%",
"showvalues": "0",
"paletteColors": "#247FF3,#f2c500",
"labeldisplay": "ROTATE",
"slantlabels": "1",
"bgColor": "#ffffff",
"borderAlpha": "20",
"showcanvasborder": "1",
"canvasborderalpha": "30",
"usePlotGradientColor": "0",
"plotBorderAlpha": "10",
"placevaluesInside": "0",
"rotatevalues": "0",
"valueFontColor": "#000000",
"plotfillalpha": "90",
"showLegend": "0",
"showHoverEffect": "1",
"xAxisLineColor": "#999999",
"divlineColor": "#999999",
"divLineIsDashed": "0",
"showAlternateHGridColor": "0",
"anchorBorderHoverThickness": "2",
"anchorHoverRadius": "5",
"toolTipColor": "#ffffff",
"toolTipBorderThickness": "0",
"toolTipBgColor": "#000000",
"toolTipBgAlpha": "80",
"toolTipBorderRadius": "2",
"toolTipPadding": "5",
"animation": "1",
"syaxismaxvalue":"100",
"legendborderalpha": "20",
"numdivlines": "10",
"numVDivLines": "10"
},
"categories": [{
"category": [{
"label": "2007"
}, {
"label": "2008"
}, {
"label": "2009"
}, {
"label": "2010"
}, {
"label": "2011"
}, {
"label": "2012"
}, {
"label": "2013"
}, {
"label": "2014"
}, {
"label": "2015"
}, {
"label": "2016"
}, {
"label": "2017"
}]
}],
"dataset": [{
"seriesName": "Annual Growth Rate For The English Wikipedia",
"data": [{
"value": "1560000"
}, {
"value": "2153000"
}, {
"value": "2679000"
}, {
"value": "3144000"
}, {
"value": "3518000"
}, {
"value": "3835000"
}, {
"value": "4133000"
}, {
"value": "4413000"
}, {
"value": "4682000"
}, {
"value": "5045000"
}, {
"value": "5530232"
}]
}, {
"seriesName": "% Of All Wikipedia Articles in English",
"parentYAxis": "S",
"renderAs": "line",
"showValues": "0",
"data": [{
"value": "74"
}, {
"value": "38"
}, {
"value": "24"
}, {
"value": "17"
}, {
"value": "12"
}, {
"value": "9"
}, {
"value": "8"
}, {
"value": "7"
}, {
"value": "6"
}, {
"value": "8"
}, {
"value": "7"
}]
}]
};
FusionCharts.ready(function () {
let wikiChart = new FusionCharts({
type: 'mscombidy2d',
renderAt: 'chart-container',
width: '70%',
height: '400',
dataFormat: 'json',
dataSource: mydata
})
.render();
});
}
Following is the entire code present in app.js file: import {FC} from 'node_modules/fusioncharts/fusioncharts.js';
import {Charts} from 'node_modules/fusioncharts/fusioncharts.charts.js';
export class App {
constructor() {
this.message = 'FusionCharts in Aurelia Framework';
}
attached(){
let mydata={
      "chart": {
        "caption": "Size Of Wikipedia",
        "subcaption": "[2007-2017]",
        "pYAxisName": "Article Count",
        "xAxisName": "Years",
        "sYAxisName": "% Increase during preceding year",
        "sNumberSuffix": "%",
        "showvalues": "0",
        "paletteColors": "#247FF3,#f2c500",
        "labeldisplay": "ROTATE",
        "slantlabels": "1",
        "bgColor": "#ffffff",
        "borderAlpha": "20",
        "showcanvasborder": "1",
        "canvasborderalpha": "30",
        "usePlotGradientColor": "0",
        "plotBorderAlpha": "10",
        "placevaluesInside": "0",
        "rotatevalues": "0",
        "valueFontColor": "#000000",
        "plotfillalpha": "90",
        "showLegend": "0",
        "showHoverEffect": "1",
        "xAxisLineColor": "#999999",
        "divlineColor": "#999999",
        "divLineIsDashed": "0",
        "showAlternateHGridColor": "0",
        "anchorBorderHoverThickness": "2",
        "anchorHoverRadius": "5",
        "toolTipColor": "#ffffff",
        "toolTipBorderThickness": "0",
        "toolTipBgColor": "#000000",
        "toolTipBgAlpha": "80",
        "toolTipBorderRadius": "2",
        "toolTipPadding": "5",
        "animation": "1",
        "syaxismaxvalue":"100",
        "legendborderalpha": "20",
        "numdivlines": "10",
        "numVDivLines": "10"
      },
      "categories": [{
        "category": [{
          "label": "2007"
        }, {
          "label": "2008"
        }, {
          "label": "2009"
        }, {
          "label": "2010"
        }, {
          "label": "2011"
        }, {
          "label": "2012"
        }, {
          "label": "2013"
        }, {
          "label": "2014"
        }, {
          "label": "2015"
        }, {
          "label": "2016"
        }, {
          "label": "2017"
        }]
      }],
      "dataset": [{
        "seriesName": "Annual Growth Rate For The English Wikipedia",
        "data": [{
          "value": "1560000"
        }, {
          "value": "2153000"
        }, {
          "value": "2679000"
        }, {
          "value": "3144000"
        }, {
          "value": "3518000"
        }, {
          "value": "3835000"
        }, {
          "value": "4133000"
        }, {
          "value": "4413000"
        }, {
          "value": "4682000"
        }, {
          "value": "5045000"
        }, {
          "value": "5530232"
        }]
      }, {
        "seriesName": "% Of All Wikipedia Articles in English",
        "parentYAxis": "S",
        "renderAs": "line",
        "showValues": "0",
        "data": [{
          "value": "74"
        }, {
          "value": "38"
        }, {
          "value": "24"
        }, {
          "value": "17"
        }, {
          "value": "12"
        }, {
          "value": "9"
        }, {
          "value": "8"
        }, {
          "value": "7"
        }, {
          "value": "6"
        }, {
          "value": "8"
        }, {
          "value": "7"
        }]
      }]
    };

FusionCharts.ready(function () {
        let wikiChart = new FusionCharts({
        type: 'mscombidy2d',
        renderAt: 'chart-container',
        width: '70%',
        height: '400',
        dataFormat: 'json',
        dataSource: mydata
    })
    .render();
});
  }
}
au run --watch The output should be as shown in the image below: To create pie charts and generate statistical data, you’ll find this list of the best…
To implement FusionCharts in a dynamically resizing flexbox layout, ensure that the chart's dimensions are…
At FusionCharts, we believe in empowering developers and businesses with cutting-edge data visualization tools that…
Ever had a data set that seemed more complicated than a Rubik's cube? You’re not…
We’ve all seen them in textbooks or presentations—those overlapping circles that simplify complex information into…
We’re excited to announce the upcoming release of FusionCharts v4.1—a groundbreaking step forward in the…
View Comments
good