Table of Contents
While Agile and Waterfall development approaches are popular amongst developers, Rapid Application Development is gaining traction as it emphasizes the processes involved rather than the planning. As such, it is an ideal approach for developing software that’s driven by user interface requirements.
CakePHP is a relatively new framework that provides a reliable base for Rapid Application Development in PHP. This framework follows the MVC (Model-View-Controller) architecture, giving developers a more robust platform for developing apps.
CakePHP supports automatic code generation using the console tool Bake, making it more straightforward for developers to develop web apps using Rapid Application Development. Additionally, the framework also supports dynamic scaffolding, allowing developers to define and create a primary application that can create, retrieve, update, and delete objects. Furthermore, it also allows developers to specify how objects are related to each other and develop and break those links.
In this tutorial, we will use a MongoDB database to store the data needed to render the chart.
Without much ado, let’s get started on using the CakePHP Framework with FusionCharts to create charts.
npm install fusionchartsnpm install fusionmapsbower install fusionchartsbower install fusionmapsThe required environment is ready with the CakePHP skeleton application. Now, we will embed our chart in it.
In this step, we will define a virtual host for our application by adding the code given below in the httpd-vhost.conf file of our apache web server.
<VirtualHost *:80>
    DocumentRoot /path/to/CakePHP framework
    ServerName cakePHP-tutorial.localhost
    SetEnv APPLICATION_ENV "development"
</VirtualHost>
Once we have made the changes in our config file, we will save the file and restart the server. We will now start our CakePHP skeleton application using this [https://cakephp-tutorial.localhost] URL to verify that we are on the right path.
After the successful installation, we noticed that the CakePHP app is still not connected to the database. We need to modify the my_app\config\app.php file as shown below to establish the connection with the MySQL database.
'Datasources' => [
        'default' => [
            'className' => 'Cake\Database\Connection',
            'driver' => 'Cake\Database\Driver\Mysql',
            'persistent' => false,
            'host' => 'localhost',
            /**
             * CakePHP will use the default DB port based on the driver selected
             * MySQL on MAMP uses port 8889, MAMP users will want to uncomment
             * the following line and set the port accordingly
             */            //'port' => 'non_standard_port_number',
            'username' => 'db_user_name',
            'password' => 'db_user_password',
            'database' => 'db_name',
            'encoding' => 'utf8',
            'timezone' => 'UTC',
            'flags' => [],
            'cacheMetadata' => true,
            'log' => false,
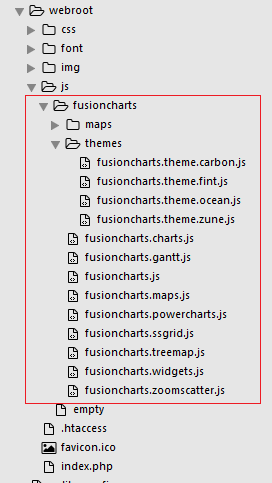
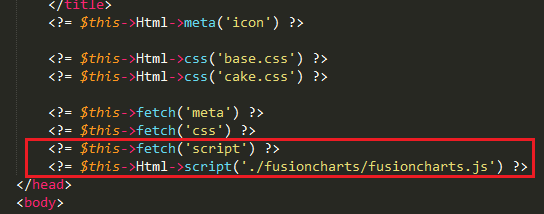
my_app/webroot/js/fusioncharts as shown below –my_app/src/Template/Layout/default.ctp file, present in the CakePHP application, and add the js file to that as the format shown below –Create the class FusionchartsController below in the file src/Controller/FusionchartsController.php.
<?php
namespace App\Controller;

use App\Controller\AppController;

class FusionchartsController extends AppController
{
 public function index()
    {

    }
} Start by creating a directory called Fusioncharts under src/Template/Fusioncharts. Now create the file Fusionchart/index.ctp. This will contain the code required to render the chart.
Let’s create the file index.ctp inside src/Template/Fusioncharts, with the following contents:
<?php
use Cake\Core\App;
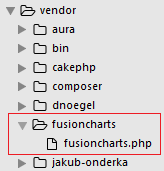
//including the FusionCharts PHP wrapper
require_once(ROOT .DS. 'vendor' . DS . 'fusioncharts' . DS . 'fusioncharts.php');
use Cake\ORM\TableRegistry;
//connecting to the database table
$chartData = TableRegistry::get('mscombi2ddata');
//query to fetch the desired data
$query = $chartData->find();
//creating the array contains chart attribute
$arrData = array(
"chart" => array(
"animation"=>"0",
"caption"=> "Albertsons SuperMart",
"subCaption"=> "No. Of Visitors Last Week",
"xAxisName"=> "Day",
"yAxisName"=> "No. Of Visitors",
"showValues"=> "0",
"paletteColors"=> "#81BB76",
"showHoverEffect"=> "1",
"use3DLighting"=> "0",
"showaxislines"=> "1",
"baseFontSize"=> "13",
"theme"=> "fint"
)
);
foreach($query as $row) {
$value = $row["value1"];
array_push($data, array(
"label" => $row["category"],
"value" => $row["value1"]
)
);
}
$arrData["data"]=$data;
//encoding the dataset object in json format
$jsonEncodedData = json_encode($arrData);
// chart object
$columnChart = new FusionCharts("column2d", "chart-1", "100%", "300", "chart-container", "json", $jsonEncodedData);
// Render the chart
$columnChart->render();
?>
// Container to render the chart
<div id="chart-container"></div>
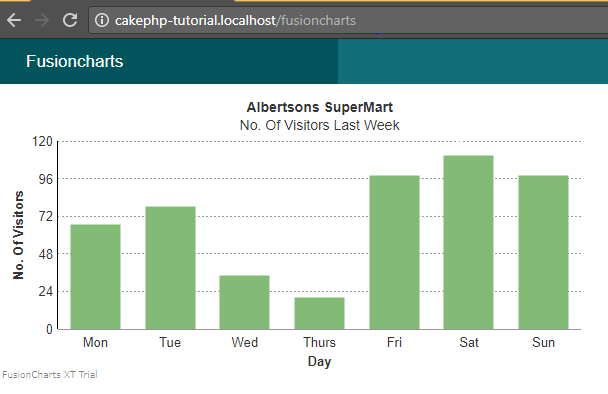
Now we will render the chart by executing the view page created for the FusionchartsController, via the browser using this URL: https://cakephp-tutorial.localhost/fusioncharts
If you’ve followed all the steps, you should have a working chart as shown in the screenshot below:
If you see any errors in your code, click here to view the complete source code of the sample project we have created for this tutorial.
A well-designed dashboard helps users understand complex data quickly, monitor key performance indicators, and make…
Quick Answer: The best commercial chart libraries for Nuxt include FusionCharts, Highcharts, AnyChart, amCharts, ApexCharts,…
Quick Answer To integrate interactive Vue charts into a Vue 3 application, first create a…
If you're looking for the best Vue chart library for interactive data visualization, there isn't…
Modern web applications generate and display more data than ever. They create from business dashboards…
Businesses collect data from multiple sources every day, including sales platforms, marketing tools, customer support…
View Comments
International charting group