Everything needs a makeover – and the latest in line was the FusionCharts Free website. Over a period of 3 weeks, we have made it chic-and-span. But why the change?
The web team has cited many technical reasons to justify the change, but the content team speculates that the web team had nothing better to do. On a more serious note, we felt that the website had collected a lot of grime over the last 18 months. So it really needed a makeover, and in the process we corrected a lot of wrongs from the older website.
In this post, we will talk about what is so awesome with the new website and what we have done to get to the awesome-ness.
Yes, we know you are very busy. So when you are paying us a visit, we want you to make the most of your time. In a bid to do that, we have enhanced the usability of the website in a number of ways.
1. The header has been made concise. So now you can see more info on the page without having to scroll.
2. The text all over the website has been neatly broken down into sub-headers, with links to them right at the top of the page. So if you are in a hurry, you know where to look.
3. The Chart Gallery uses page overlay to show the charts. So when you click on a chart thumbnail, the chart itself opens up in a new page overlaid over the main chart gallery page. So you can check out the entire java script chart gallery without ever having to leave the main page. The navigation buttons below the charts simplify the process further.
4. A Quick Links section has been appended to the header that gives you one-click access to the internal pages of our other products as well.
5. It follows the same structure as our parent FusionCharts website. This gives you an inherent sense of familiarity if you are going from one website to another.
We pride ourselves on how quickly our websites load. With this website, we have stepped it up a notch. And how?
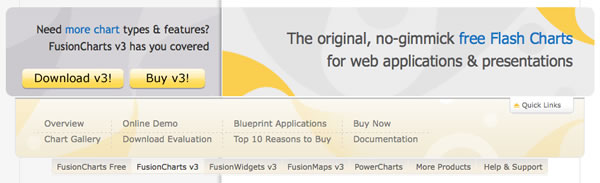
Our marketing team was forever bugging the web team on how a lot of people thought FusionCharts Free is FusionCharts v3 evaluation, and how something needed to be done about it. The web team finally obliged. With the new website, all the confusion has been done away with – once and for all. Big questions like the one below have been put up wherever applicable.
And that’s about it.
Oh, you are still reading. Why not go check out the website instead?
Quick Answer You can add interactive charts to a TypeScript project using a JavaScript charting…
TL;DR A line chart plots data points along an x-axis (time) and y-axis (value), connected…
Bar charts, line charts, column charts- they all look similar, but picking the wrong one…
An area chart has been seen before, perhaps monitoring stock market data, web traffic, or…
Have you ever read a quarterly report of a company, a sports result, or a…
Quick Answer: Choose a JavaScript library based on the charts and interactions your application needs.…
View Comments
Great post! Love the blog! Have added it to my favourites!