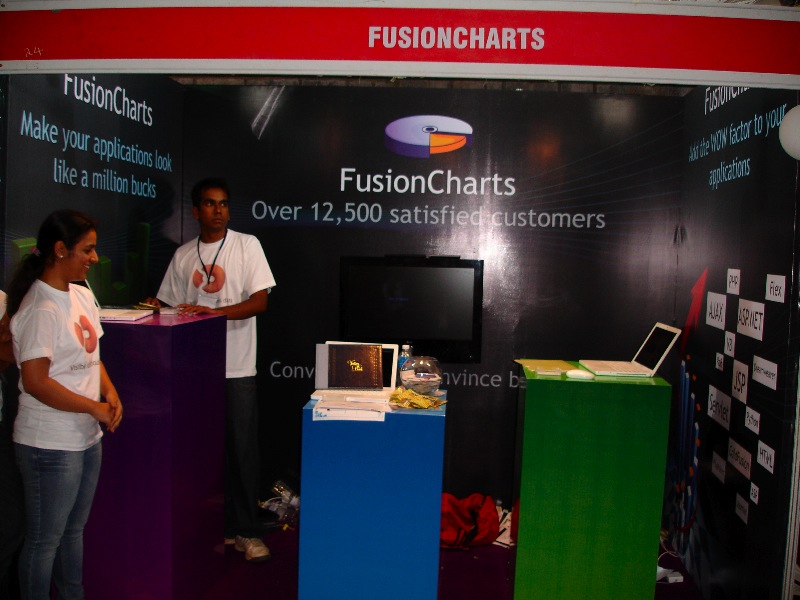
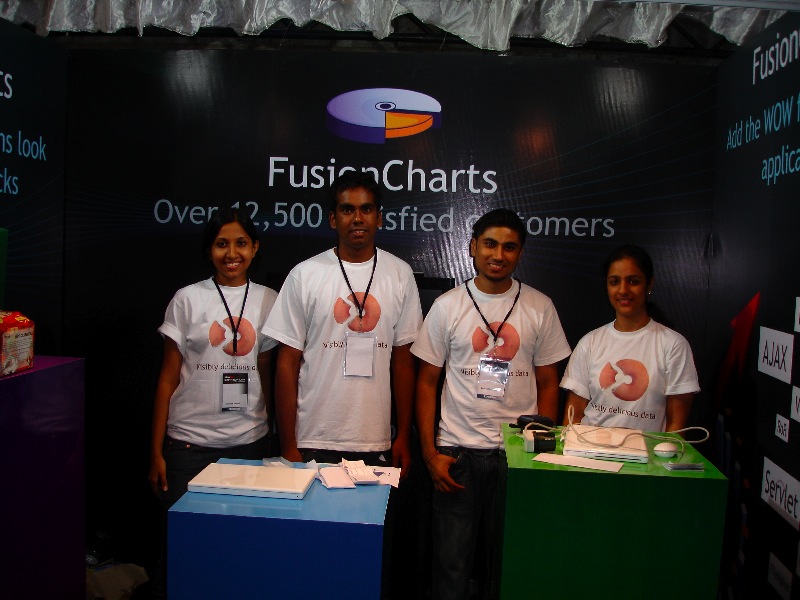
We are back from Silicon India Startup City in Bangalore and it was so much fun to interact with the Bangalore Tech Community this time around ! This was the first time we were participating in a trade fair in India, and we were naturally very excited. A lot of work went into planning and executing the stall set-up, including the designs and the logistics, the details of which are best left for another post. Thankfully, the hard work paid off and the stall looked…how does one put this mildly…absolutely stunning! 🙂
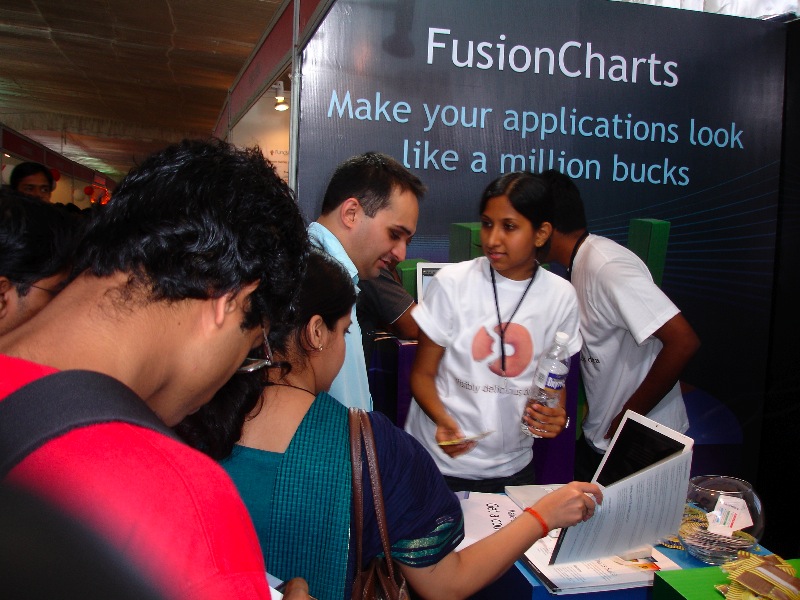
The FusionCharts stall and the demos was an instant hit with the visitors. We also met some of our existing clients from Bangalore. And once the contests started rolling out there was no stopping the fun and the goodies. One of the contests was called ‘Make a chart Get a cookie‘ where hundreds of visitors saw how beautiful flash charts can be made in a wink and got rewarded in delicious Australian cookies.
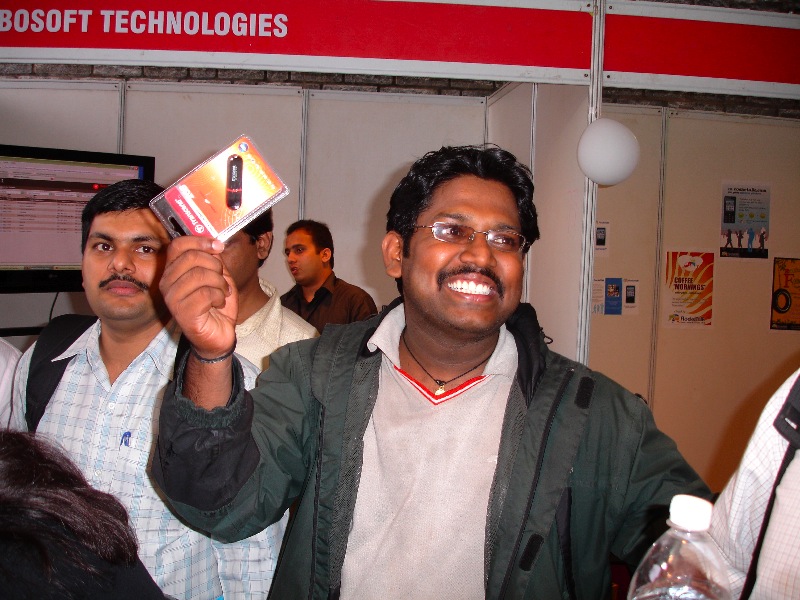
Then we had ‘Write a Slogan Win a Pen Drive‘ contest where the winners went home with a free flash drive. Like the winner Ganesh (picture below) who went home ecstatic with the pen drive he won!
If you are already wishing you were there, there was more. We thought we would leave the best for the last. We gave out free FusionCharts License worth $100,000 . Yes, you read that right. One hundred thousand US dollar worth of dazzling flash charts for your data, FREE!
We had a busy day meeting some enthusiastic corporates who were really inquisitive about integration of our flash charts in their business applications.What was really special for us in this event was the fact that we came face to face with our loved customers first time in a startup event in India and met some really promising developers who were willing to take that leap, to add that extra edge to their data. Of course, it was greatly inspiring to meet the best of the IT entrepreneurs from India.
The response to the event has quite honestly overwhelmed us here at FusionCharts. We are now eagerly looking forward to similar events in the coming months. In case you missed out this time, watch out. For all you know, the FusionCharts bus might in your town with the goodies some day!
Quick Answer To integrate interactive Vue charts into a Vue 3 application, first create a…
If you're looking for the best Vue chart library for interactive data visualization, there isn't…
Modern web applications generate and display more data than ever. They create from business dashboards…
Businesses collect data from multiple sources every day, including sales platforms, marketing tools, customer support…
Businesses generate more data than ever, from sales and marketing metrics to customer behavior and…
Choosing the right React chart library can be challenging. Some libraries are built for simple…
View Comments
This was the first time we were participating in a trade fair in India, and we were naturally very excited.