Meteor is a powerful platform for building responsive web and mobile applications. It makes use of modular components, full-stack reactivity, and wire-based data transmission.
It is a full-stack framework for developing real-time web applications for desktop and mobile platforms. Even inexperienced developers can quickly create something impressive and useful, which is why advanced developers value MeteorJS’s flexibility. It makes use of MongoDB as its database, as well as its own development and testing tools. It also makes use of the distributed data protocol and the publish-subscribe pattern, which help to propagate data changes to clients without the need for synchronized code written by a developer. It can also be supplemented with third-party packages like Atmosphere or MPM.
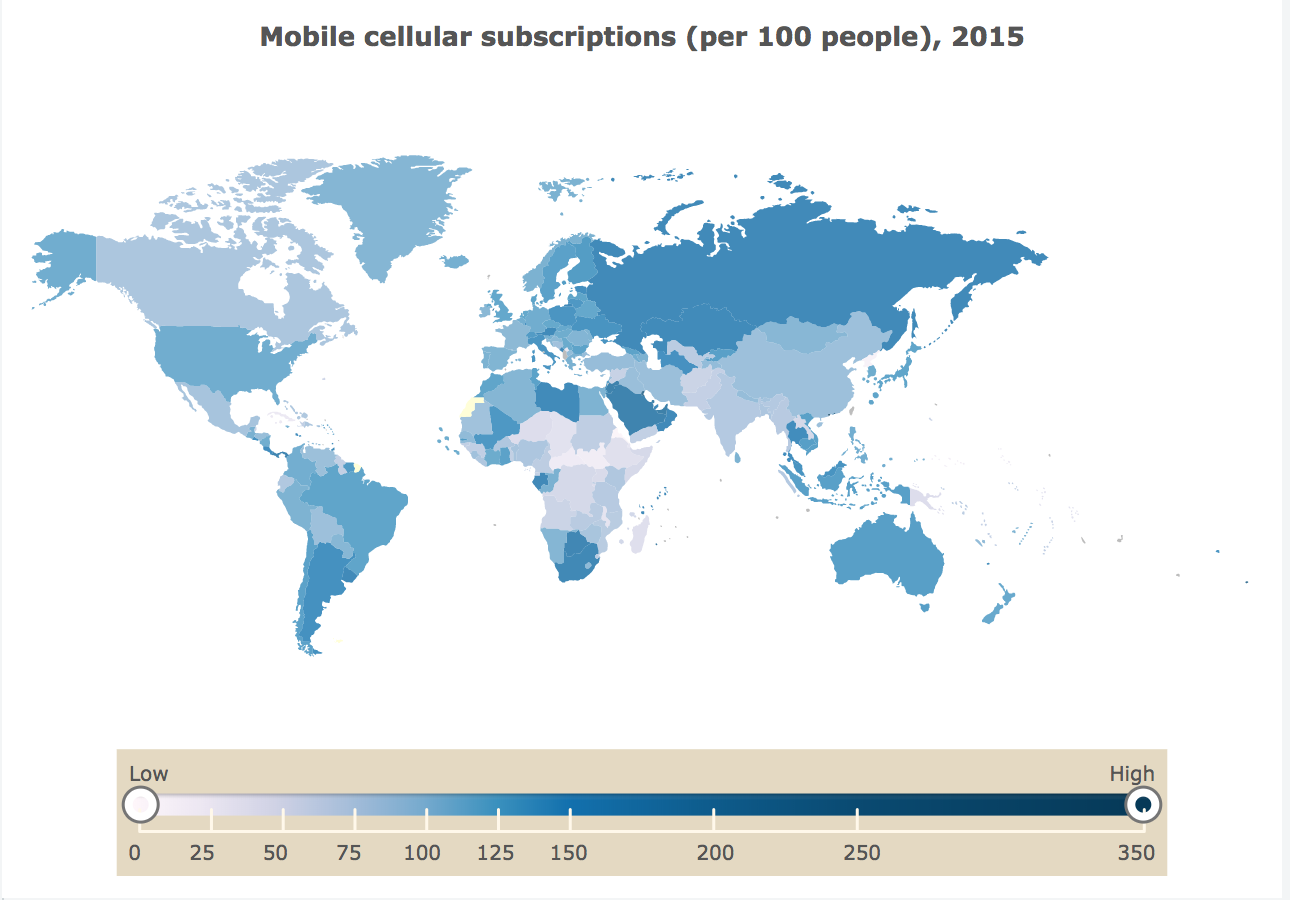
In this post, you will learn how to create projects with Data Charts using Meteor JS and FusionCharts components.
Let’s take a look at what Meteor requires to function properly:
Chocolatey – Install Chocolatey. For Installing it with cmd.exe, execute the following command in the terminal:
@"%SystemRoot%\System32\WindowsPowerShell\v1.0\powershell.exe" -NoProfile -InputFormat None -ExecutionPolicy Bypass -Command "iex ((New-Object System.Net.WebClient).DownloadString('https://chocolatey.org/install.ps1'))" && SET "PATH=%PATH%;%ALLUSERSPROFILE%\chocolatey\bin" MeteorJS – To install MeteorJS, execute the following command in the terminal:
choco install meteor
FusionCharts – To install FusionCharts module, execute the following command in the terminal:
meteor npm install fusioncharts --save
FusionMaps – To install FusionMaps module, execute the following command in the terminal:
meteor npm install fusionmaps
Table of Contents
Once you’ve installed Meteor, create a project. Run the following command in the terminal:
meteor create myapp
The above command will create a new folder named myapp with all the files that a Meteor app needs.
To run the newly created app, execute the following commands:
cd myapp

meteor
The above command will take us to a page in a browser – https://localhost:3000/
Let’s move on to the next phase of the process to edit the HTML and JS file to render FusionMaps.
Replace the existing HTML code with the code given below:
<head>
  <title>Fusioncharts MeteorJS Integration</title>
</head>

<body>
  <h1>Fusioncharts Integration with MeteorJS</h1>
  {{> fusioncharts}}
</body>

<template name="fusioncharts">
  <div></div>
</template>
In the JS file, replace the existing js code with the code given below to import the required dependency:
import { Template } from 'meteor/templating';
// Load the maps module
import FusionCharts from 'fusioncharts';
import FusionMaps from 'fusionmaps';
import Maps from 'fusionmaps/fusioncharts.maps';
import FintTheme from 'fusioncharts/themes/fusioncharts.theme.fint';
import World from 'fusionmaps/maps/fusioncharts.world';
import Countries from 'fusionmaps/maps/fusioncharts.worldwithcountries';

//import the HTML
import './main.html';
Now we need to pass the dependency using the following code:
//passing dependency
Maps(FusionMaps);
FintTheme(FusionCharts);
World(FusionMaps);
Countries(FusionMaps);
Next, we will create the instance of the template fusioncharts using the following code-
Template.fusioncharts.onCreated(function () {
this.type = "maps/worldwithcountries";
this.width = 600;
this.height = 400;
this.dataFormat = 'json';
this.dataSource = {
"chart": {
"animation": "0",
"showbevel": "0",
"usehovercolor": "1",
"canvasbordercolor": "FFFFFF",
"bordercolor": "0000fd",
"showlegend": "1",
"showshadow": "0",
"legendposition": "BOTTOM",
"legendborderalpha": "0",
"legendbordercolor": "ffffff",
"legendallowdrag": "0",
"legendshadow": "0",
"caption": "Mobile cellular subscriptions (per 100 people), 2015",
"connectorcolor": "000000",
"fillalpha": "80",
"hovercolor": "CCCCCC",
"showborder": "0",
"showLabels":"0",
"showEntityHoverEffect":"1",
"borderAlpha":"60",
"entityBorderHoverThickness":"1",
"nullEntityColor":"ADACAC",
"entityToolText": "<div style='font-size:14px; text-align:center; padding: 2px 4px 2px 4px; color:black;'>$lName</div><hr/><div style='font-size:12px;'>$value per 100 people</div>",
},
"colorrange": {
"minvalue": "0",
"startlabel": "Low",
"endlabel": "High",
"code": "FFF7FB",
"gradient": "1",
"color": [{
"maxvalue": "25",
"code": "ECE7F2"
}, {
"maxvalue": "50",
"code": "D0D1E6"
},{
"maxvalue": "75",
"code": "A6BDDB"
},
{
"maxvalue": "100",
"code": "74A9CF"
},
{
"maxvalue": "125",
"code": "3690C0"
},
{
"maxvalue": "150",
"code": "0570B0"
},
{
"maxvalue": "200",
"code": "045A8D"
},
{
"maxvalue": "250",
"code": "034973"
},
{
"maxvalue": "350",
"code": "023858"
}]
},
"data": [{
"id": "01",
"value": "137.2"
}, {
"id": "02",
"value": "80.29"
}, {
"id": "03",
"value": "116.4"
}, {
"id": "04",
"value": "60.97"
}, {
"id": "05",
"value": "82.97"
}, {
"id": "06",
"value": "150.6"
}, {
"id": "07",
"value": "29.65"
}, {
"id": "08",
"value": "106.2"
}, {
"id": "09",
"value": "82.58"
}, {
"id": "10",
"value": "145.2"
}, {
"id": "11",
"value": "112.2"
}, {
"id": "12",
"value": "112.2"
}, {
"id": "13",
"value": "68.84"
}, {
"id": "14",
"value": "95.54"
}, {
"id": "15",
"value": "111.5"
}, {
"id": "16",
"value": "85.98"
}, {
"id": "17",
"value": "116.1"
}, {
"id": "18",
"value": "174.1"
}, {
"id": "19",
"value": "131.8"
}, {
"id": "20",
"value": "101.5"
}, {
"id": "21",
"value": "103.6"
}, {
"id": "22",
"value": "157.6"
}, {
"id": "23",
"value": "117.5"
}, {
"id": "24",
"value": "106.5"
}, {
"id": "25",
"value": "146.7"
}, {
"id": "26",
"value": "92.18"
}, {
"id": "27",
"value": "126.5"
}, {
"id": "28",
"value": "129.4"
}, {
"id": "29",
"value": "115.7"
}, {
"id": "30",
"value": "79.77"
}, {
"id": "31",
"value": " "
}, {
"id": "32",
"value": " "
}, {
"id": "33",
"value": "67.18"
}, {
"id": "34",
"value": "105.3"
}, {
"id": "35",
"value": "109.8"
}, {
"id": "36",
"value": "136.8"
}, {
"id": "37",
"value": "160.2"
}, {
"id": "38",
"value": "92.9"
}, {
"id": "39",
"value": "106.3"
}, {
"id": "40",
"value": "60.84"
}, {
"id": "41",
"value": "85.64"
}, {
"id": "42",
"value": "169.0"
}, {
"id": "43",
"value": "80.64"
}, {
"id": "44",
"value": "46.22"
}, {
"id": "45",
"value": "71.84"
}, {
"id": "46",
"value": "118.5"
}, {
"id": "47",
"value": "25.86"
}, {
"id": "48",
"value": "40.17"
}, {
"id": "49",
"value": "55.16"
}, {
"id": "50",
"value": "119.3"
}, {
"id": "51",
"value": "52.9"
}, {
"id": "52",
"value": "34.94"
}, {
"id": "53",
"value": "110."
}, {
"id": "54",
"value": "66.71"
}, {
"id": "55",
"value": "7.049"
}, {
"id": "56",
"value": "42.76"
}, {
"id": "57",
"value": "161.1"
}, {
"id": "58",
"value": "129.7"
}, {
"id": "59",
"value": "69.27"
}, {
"id": "60",
"value": "69.27"
}, {
"id": "61",
"value": "80.67"
}, {
"id": "62",
"value": "100.9"
}, {
"id": "63",
"value": "81.09"
}, {
"id": "64",
"value": "157.0"
}, {
"id": "65",
"value": "44.1"
}, {
"id": "66",
"value": "37.93"
}, {
"id": "67",
"value": "139.6"
}, {
"id": "68",
"value": "89.32"
}, {
"id": "69",
"value": "126.8"
}, {
"id": "70",
"value": "74.23"
}, {
"id": "71",
"value": "106.5"
}, {
"id": "72",
"value": "46.49"
}, {
"id": "73",
"value": "82.18"
}, {
"id": "74",
"value": "70.48"
}, {
"id": "75",
"value": "65.09"
}, {
"id": "76",
"value": "99.94"
}, {
"id": "77",
"value": "158.1"
}, {
"id": "78",
"value": "89.52"
}, {
"id": "79",
"value": "52.46"
}, {
"id": "80",
"value": "164.5"
}, {
"id": "81",
"value": "70.52"
}, {
"id": "82",
"value": "73.20"
}, {
"id": "83",
"value": "75.85"
}, {
"id": "84",
"value": "67.70"
}, {
"id": "85",
"value": "129.9"
}, {
"id": "86",
"value": "50.37"
}, {
"id": "87",
"value": " "
}, {
"id": "88",
"value": "74.47"
}, {
"id": "89",
"value": "84.78"
}, {
"id": "90",
"value": "137"
}, {
"id": "91",
"value": "111.6"
}, {
"id": "92",
"value": " "
}, {
"id": "93",
"value": "61.57"
}, {
"id": "94",
"value": "115.8"
}, {
"id": "95",
"value": "111."
}, {
"id": "96",
"value": "81.89"
}, {
"id": "97",
"value": "87.02"
}, {
"id": "98",
"value": "108.1"
}, {
"id": "99",
"value": "75.68"
}, {
"id": "100",
"value": "133.0"
}, {
"id": "101",
"value": "92.1"
}, {
"id": "102",
"value": "117.3"
}, {
"id": "103",
"value": "128.9"
}, {
"id": "104",
"value": "78.06"
}, {
"id": "105",
"value": "132."
}, {
"id": "106",
"value": "93.38"
}, {
"id": "107",
"value": "126.5"
}, {
"id": "108",
"value": "156.8"
}, {
"id": "109",
"value": "12.87"
}, {
"id": "110",
"value": "118.4"
}, {
"id": "111",
"value": "132"
}, {
"id": "112",
"value": "53.09"
}, {
"id": "113",
"value": "143.8"
}, {
"id": "114",
"value": "104.9"
}, {
"id": "115",
"value": "96.74"
}, {
"id": "116",
"value": "66.91"
}, {
"id": "117",
"value": "115.7"
}, {
"id": "118",
"value": "159.9"
}, {
"id": "119",
"value": "146.5"
}, {
"id": "120",
"value": "110.5"
}, {
"id": "121",
"value": "98.5"
}, {
"id": "122",
"value": "152.7"
}, {
"id": "123",
"value": "145.9"
}, {
"id": "124",
"value": "73.31"
}, {
"id": "125",
"value": "130.6"
}, {
"id": "126",
"value": " "
}, {
"id": "127",
"value": "228.6"
}, {
"id": "128",
"value": "324.4"
}, {
"id": "129",
"value": " "
}, {
"id": "130",
"value": "88.12"
}, {
"id": "131",
"value": "157.4"
}, {
"id": "132",
"value": "123.6"
}, {
"id": "133",
"value": "115.6"
}, {
"id": "134",
"value": "90.15"
}, {
"id": "135",
"value": "129.2"
}, {
"id": "136",
"value": "103.7"
}, {
"id": "137",
"value": "123.1"
}, {
"id": "138",
"value": "128.3"
}, {
"id": "139",
"value": "148.6"
}, {
"id": "140",
"value": "135.4"
}, {
"id": "141",
"value": "102.6"
}, {
"id": "142",
"value": "116.7"
}, {
"id": "143",
"value": "112."
}, {
"id": "144",
"value": "118."
}, {
"id": "145",
"value": "114.0"
}, {
"id": "146",
"value": "103.7"
}, {
"id": "147",
"value": "142.1"
}, {
"id": "148",
"value": "127.5"
}, {
"id": "149",
"value": "109.3"
}, {
"id": "150",
"value": "139.5"
}, {
"id": "151",
"value": "148.5"
}, {
"id": "152",
"value": "98.78"
}, {
"id": "153",
"value": "129.2"
}, {
"id": "154",
"value": "108.0"
}, {
"id": "155",
"value": "88.77"
}, {
"id": "156",
"value": "162.1"
}, {
"id": "157",
"value": "123.5"
}, {
"id": "158",
"value": "111.1"
}, {
"id": "159",
"value": "142.6"
}, {
"id": "160",
"value": "110.4"
}, {
"id": "161",
"value": "107.1"
}, {
"id": "162",
"value": "115.1"
}, {
"id": "163",
"value": "120.5"
}, {
"id": "164",
"value": "122.3"
}, {
"id": "165",
"value": "113.2"
}, {
"id": "166",
"value": "108.1"
}, {
"id": "167",
"value": "130.3"
}, {
"id": "168",
"value": "136.4"
}, {
"id": "169",
"value": "144.0"
}, {
"id": "170",
"value": "124.1"
}, {
"id": "171",
"value": " "
}, {
"id": "172",
"value": "95.40"
}, {
"id": "173",
"value": "96.02"
}, {
"id": "175",
"value": "132.8"
}, {
"id": "176",
"value": "108.2"
}, {
"id": "177",
"value": "38.84"
}, {
"id": "178",
"value": "29.24"
}, {
"id": "179",
"value": "21.54"
}, {
"id": "180",
"value": "67.78"
}, {
"id": "181",
"value": "121.8"
}, {
"id": "182",
"value": "111.5"
}, {
"id": "183",
"value": "46.64"
}, {
"id": "184",
"value": "62.37"
}, {
"id": "185",
"value": "72.6"
}, {
"id": "186",
"value": "69.08"
}, {
"id": "187",
"value": "40.33"
}, {
"id": "188",
"value": "66.24"
}, {
"id": "189",
"value": "98.90"
}, {
"id": "190",
"value": "185.2"
}, {
"id": "191",
"value": "93.8"
}, {
"id": "192",
"value": "133.4"
}, {
"id": "193",
"value": "179.4"
}, {
"id": "194",
"value": "231.7"
}, {
"id": "195",
"value": "92.16"
}, {
"id": "196",
"value": "159.8"
}, {
"id": "197",
"value": "159.1"
}, {
"id": "198",
"value": "176.5"
}, {
"id": "199",
"value": "64.28"
}, {
"id": "200",
"value": "187.3"
}, {
"id": "201",
"value": "67.98"
}, {
"id": "202",
"value": "87.09"
}, {
"id": "203",
"value": "155."
}, {
"id": "204",
"value": "23.85"
}, {
"id": "205",
"value": "32.41"
}, {
"id": "206",
"value": "135.7"
}, {
"id": "207",
"value": " "
}, {
"id": "208",
"value": "23.796"
}, {
"id": "209",
"value": "57.94"
}, {
"id": "210",
"value": " "
}, {
"id": "211",
"value": " "
}, {
"id": "212",
"value": " "
}, {
"id": "213",
"value": " "
}, {
"id": "214",
"value": "94.89"
}, {
"id": "215",
"value": " "
}, {
"id": "216",
"value": "141.1"
}, {
"id": "217",
"value": " "
}, {
"id": "218",
"value": "61.94"
}, {
"id": "219",
"value": " "
}, {
"id": "220",
"value": " "
}, {
"id": "221",
"value": " "
}, {
"id": "222",
"value": "206.6"
}, {
"id": "223",
"value": " "
}, {
"id": "224",
"value": " "
}, {
"id": "225",
"value": " "
}, {
"id": "226",
"value": " "
}, {
"id": "227",
"value": " "
}, {
"id": "228",
"value": "115.8"
}, {
"id": "229",
"value": "155.2"
}, {
"id": "230",
"value": " "
}, {
"id": "231",
"value": " "
}, {
"id": "232",
"value": "230.95"
}, {
"id": "233",
"value": "200."
}, {
"id": "234",
"value": " "
}, {
"id": "235",
"value": " "
}, {
"id": "236",
"value": " "
}, {
"id": "237",
"value": " "
}, {
"id": "238",
"value": "145.8"
}, {
"id": "239",
"value": "74.51"
}, {
"id": "240",
"value": " "
}, {
"id": "241",
"value": " "
}]
};
});
Copy the JS code given below to your file, to insert the instance of the FusionCharts template into the DOM
Template.fusioncharts.onRendered(function () {
  this.chartObj = new FusionCharts({
    width: this.width,
    height: this.height,
    renderAt: this.firstNode,
    type: this.type,
    dataFormat: this.dataFormat,
    dataSource: this.dataSource
  });
  this.chartObj.render();
});
Start the server using command meteor and check the URL- https://localhost:3000/ in your browser. The output looks like as shown below:
If you see any errors in your code or have trouble executing the above sample, click here to download the complete source code of the sample project we have created for this tutorial.
A well-designed dashboard helps users understand complex data quickly, monitor key performance indicators, and make…
Quick Answer: The best commercial chart libraries for Nuxt include FusionCharts, Highcharts, AnyChart, amCharts, ApexCharts,…
Quick Answer To integrate interactive Vue charts into a Vue 3 application, first create a…
If you're looking for the best Vue chart library for interactive data visualization, there isn't…
Modern web applications generate and display more data than ever. They create from business dashboards…
Businesses collect data from multiple sources every day, including sales platforms, marketing tools, customer support…