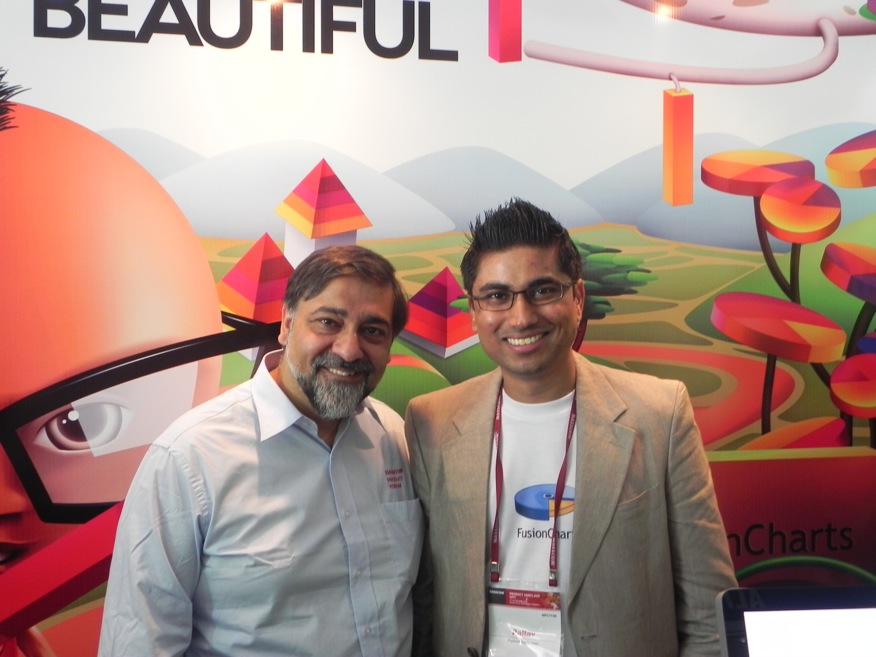
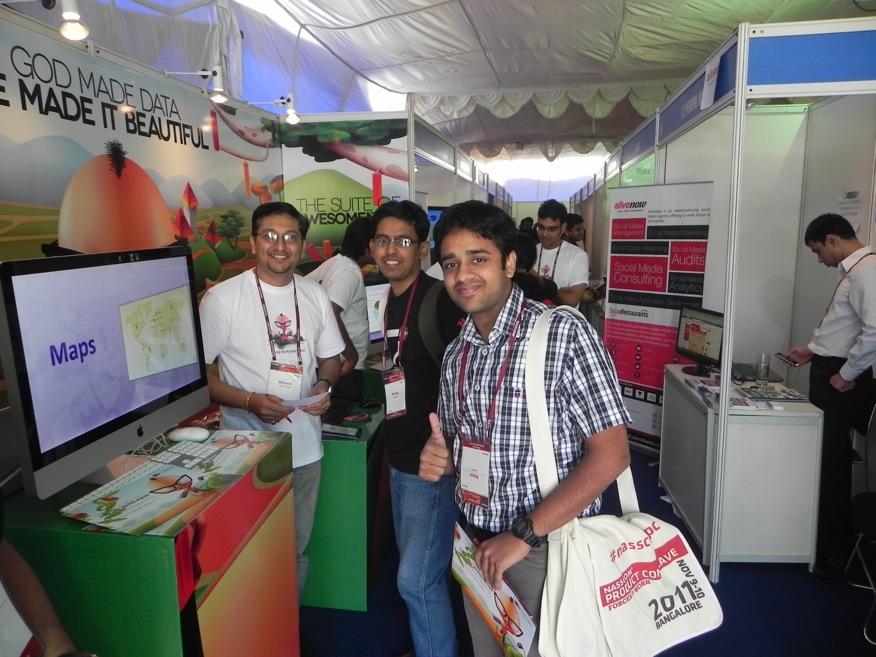
We are just back from the NASSCOM Product Conclave and the whole two days have been a lot of fun. Meeting up with customers, showcasing our product and getting a round of “wow” every time, and just enjoying the high energy level with young and upcoming entrepreneurs made the whole experience even more fun.
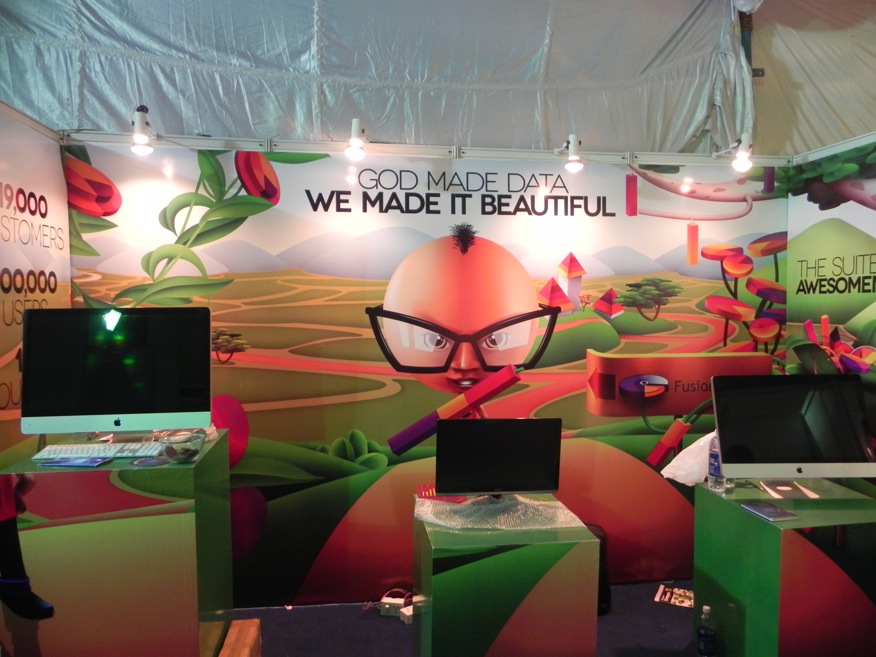
As we promised, our booth at the expo turned out to be really refreshing. So much so that a couple of people asked us if we were into gaming! Here are a few pictures to help you get a glimpse of what I mean…
Even as we started, we made it a point to go the extra mile and make our booth look as stunning as our product. The “Chart Forest” theme was refreshing, and we decided to put the dude up front and center.
The result? Everybody loved our booth. Enterprises, entrepreneurs and students alike…
Check out our Facebook page to get the whole story and more pictures.
TL;DR A line chart plots data points along an x-axis (time) and y-axis (value), connected…
Bar charts, line charts, column charts- they all look similar, but picking the wrong one…
An area chart has been seen before, perhaps monitoring stock market data, web traffic, or…
Have you ever read a quarterly report of a company, a sports result, or a…
Quick Answer: Choose a JavaScript library based on the charts and interactions your application needs.…
Interactive dashboards have become essential for SaaS applications, business intelligence (BI) platforms, and enterprise software.…