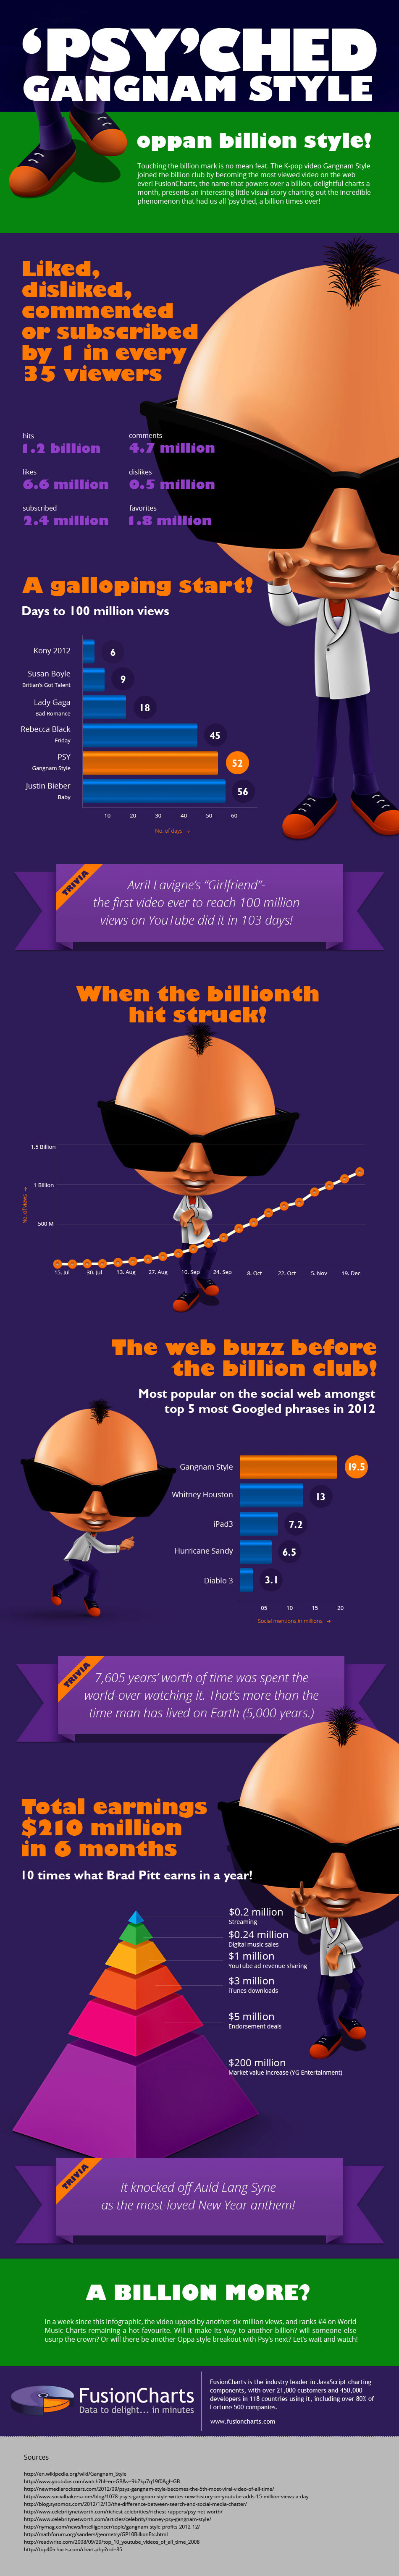
Touching the billion mark is no mean feat. The K-pop video Gangnam Style joined the billion club by becoming the most viewed video on the web ever! FusionCharts, the name that powers over a billion delightful charts a month presents an interesting little visual story charting out the incredible phenomenon that has us psyched, a billion times over!
A well-designed dashboard helps users understand complex data quickly, monitor key performance indicators, and make…
Quick Answer: The best commercial chart libraries for Nuxt include FusionCharts, Highcharts, AnyChart, amCharts, ApexCharts,…
Quick Answer To integrate interactive Vue charts into a Vue 3 application, first create a…
If you're looking for the best Vue chart library for interactive data visualization, there isn't…
Modern web applications generate and display more data than ever. They create from business dashboards…
Businesses collect data from multiple sources every day, including sales platforms, marketing tools, customer support…
View Comments
5000 years? Where did you get that from? Pretty sure modern man has existed for much longer.