
Table of Contents
What is an Easy Way to Create a Beautiful and Insightful SaaS Dashboard?
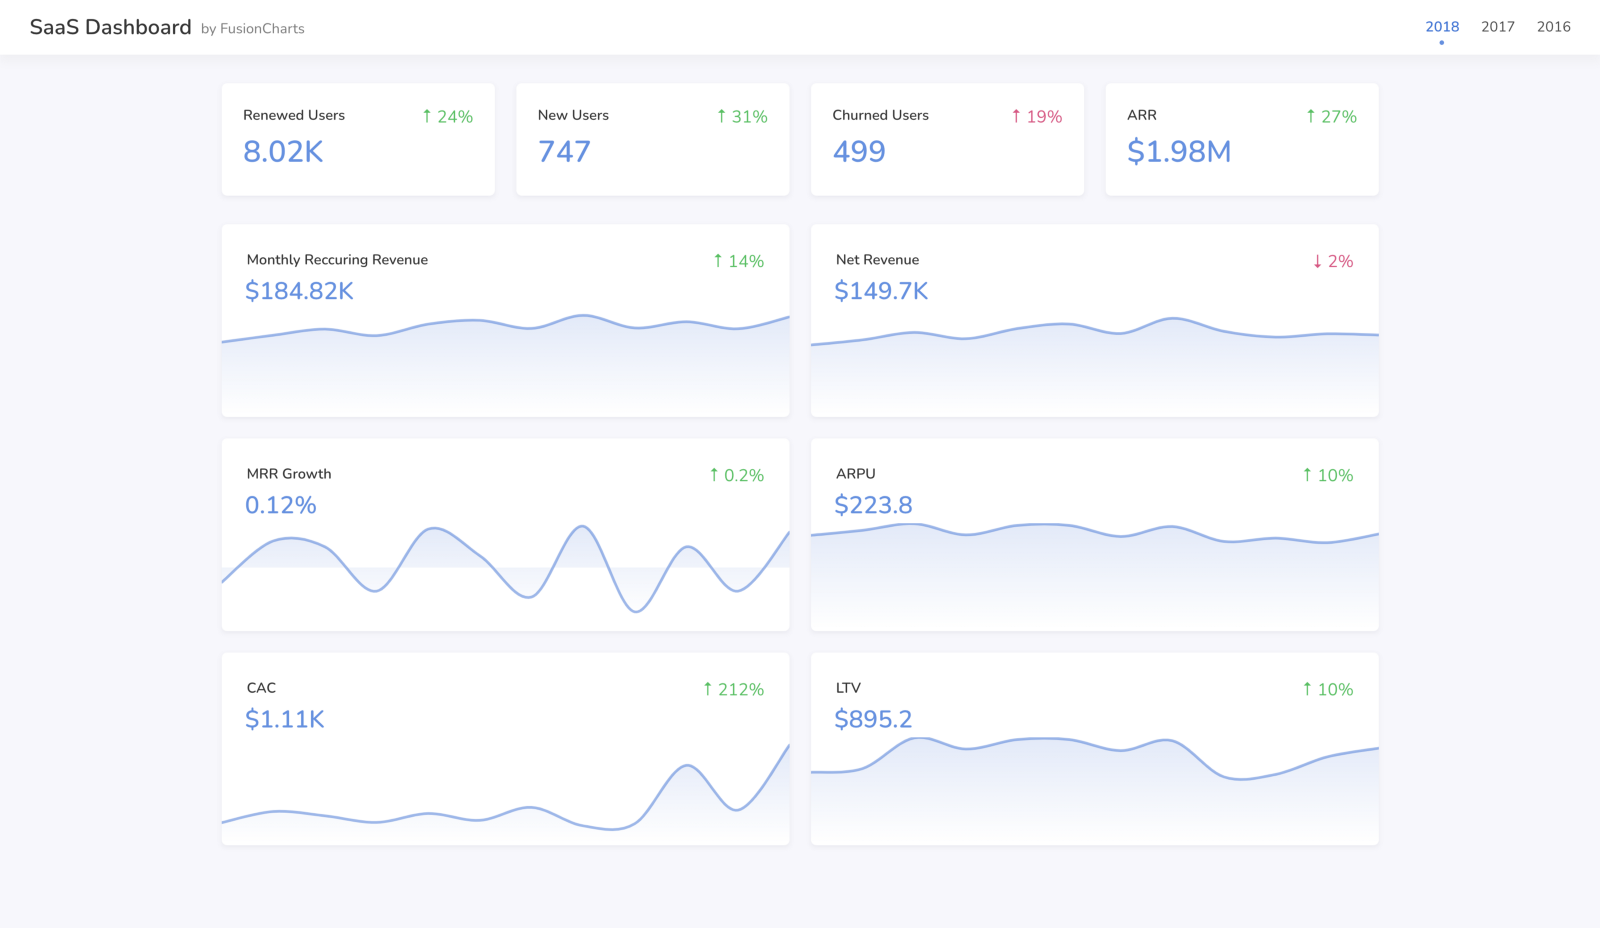
For the sake of this tutorial, we will refer to one of our previous tutorials that talks in detail about creating powerful SaaS dashboards with JavaScript and Bootstrap. If you already have your dashboard prepared and are ready to move ahead with generating PDF reports, then this tutorial is for you. If you haven’t created your dashboard yet, don’t worry about it. Go back and take a look at the tutorial. We will still be here when you are through!
How Can I Quickly Export Data Visualizations to PDF Using FusionExport?
Once your FusionCharts dashboard is up and running, you can learn how to export that information to PDF using FusionExport and Node.js SDK. Here is how you can do it:
FusionExport Server Setup
Before you can write the code to export the PDF reports, you need to download and install the FusionExport server. It supports a variety of different languages and platforms. Go ahead and download the one that matches your preferences. After downloading the zip file you need, unzip it, navigate to the main package directory, and run the following command. ./fusionexport This will start your FusionExport server on the default port 1337.Node.js SDK Installation
After you have the FusionExport server set up, you need to install the Node.js SDK. The Node.js SDK will serve as the client for the FusionExport server.
Initiate a new Node project and run the following command to add the FusionExport Node client to your Node project.
npm install fusionexport-node-client --save
How do I Export a Template HTML to PDF?
Before we make our dashboard available for PDF export, you need to create a simple HTML template that converts your data to PDF upon exporting. You can do that as follows:
Create a new JavaScript file, and call it export-dashboard.js. Next you need to import and initialize all the relevant dependencies you need for the PDF conversion.
const {
    ExportManager,
    ExportConfig
  } = require('fusionexport-node-client');
const exportConfig = new ExportConfig();
const exportManager = new ExportManager();
After initializing the required modules, you will need to set up some basic configurations which tell the system that it needs to export our stuff in the form of a PDF.
let template = '<h1>Exporting PDF with FusionExport</h1>';
exportConfig.set('template', template);
exportConfig.set('type', 'pdf');
exportConfig.set('templateFormat', 'a4');
Once you have all your configuration done, you are ready to export your first HTML page to PDF. To do that, use the following piece of code:
exportManager.export(exportConfig, outputDir = '.', unzip = true)
    .then((exportedData) => {
        exportedData.forEach(data => console.log(data));
})
    .catch((err) => {
        console.log(err);
});
Upon running the following command in the terminal, you should see your HTML template exported as a PDF file. You can find it in your main project directory.
node export-dashboard.js
Exporting Your Dashboard to PDF
Exporting Your Dashboard to PDF is similar to how you exported the HTML template. The critical difference is that, in this instance, you create a separate HTML file and load it into your JavaScript code instead of making an HTML string directly in your JavaScript file. This prevents the code from becoming a mess and promotes best practices by separating concerns within your code.
Create a new file. Call it export-dashboard.html, and write the following piece of code into it.
<html>
    <body>
        <h1>Dashboard Export with FusionExport</h1>
        <div id="dashboard"></div>
        <script>
            // Your FusionCharts Dashboard Code Goes Here...
        </script>
    </body>
</html>
When you are done, the final code to export your dashboard to PDF should look something like the following:
const {
    ExportManager,
    ExportConfig
  } = require('fusionexport-node-client');
const path = require('path');
const exportConfig = new ExportConfig();
const exportManager = new ExportManager();
const dashboardHTML = path.join(__dirname, 'export-dashboard.html');
exportConfig.set('dashboardFilePath', dashboardHTML);
exportConfig.set('type', 'pdf');
exportConfig.set('templateFormat', 'a4');
exportConfig.set('asyncCapture', true);
exportManager.export(exportConfig, outputDir = '.', unzip = true)
    .then((exportedData) => {
        exportedData.forEach(data => console.log(data));
})
    .catch((err) => {
        console.log(err);
});
Upon running the
node export-dashboard.js
command again, in the main project directory, you should see your dashboard exported as a PDF file.