Exporting Charts and Chart Data Using the Client-side Export Feature
FusionCharts Suite XT, starting v3.8.0, includes support for client-side exporting.
While FusionCharts has an established server-side exporting feature, common concerns with this feature include:
- Availability of a good internet connection to send to and receive data from the server
- Confidentiality concerns around using the publicly hosted export server
- Technical proficiency at the client's end
FusionCharts provides programs to set up the export server at a client’s end, but this requires the end user(s) to have a certain amount of knowledge about configuring and using servers. This, again, is a downside.
The primary need for coming up with the client-side export feature was to eliminate the need of a server for exporting, thus bringing down the turnaround time it takes for an export, as well as to address the data confidentiality issues. The client-side export feature removes the round-trip involved in exporting from a server and eliminates the difficulties involved in setting up one with the proper dependencies.
Please note that, at present, this feature is supported only by the Chrome, Firefox, and IE >= 10 browsers. The FusionCharts team is working to include support for other browsers also.
Given below is a brief description of the attributes that are used to enable client-side exporting:
| Attribute Name | Type | Range | Description |
|---|---|---|---|
exportEnabled |
Boolean | 0/1 | Enables the exporting feature in charts, when set to 1 Default value: 0 (the exporting feature is disabled) |
exportMode |
String | server, client, auto | When chart exporting is enabled, this attribute is used to switch between the modes of export. To enable client-side exporting, set this attribute to client. Default value: auto (the auto exporting feature is enabled) Note: Starting v3.12.1, the exportMode attribute replaces the exportAtClientSide attribute. However, you don’t need to make any changes to the existing setup because, starting v3.12.1, the FusionCharts library comes with the proper mapping already provided. |
exportAtClientSide |
Boolean | 0/1 | Applicable only till v3.12.0 If chart exporting is enabled, this attribute is used to set whether charts will be exported on the client-side or the server-side. Default value: 0 (server-side exporting is enabled) |
The sample chart below showcases the client-side export feature. As with server-side export, click  from the top-right corner of the chart and select Export as JPG.
{
"chart": {
"caption": "Monthly Revenue",
"subCaption": "Last year",
"xAxisName": "Month",
"yAxisName": "Amount (In USD)",
"numberPrefix": "$",
"canvasBgAlpha": "0",
"bgColor": "#DDDDDD",
"bgAlpha": "50",
"exportEnabled": "1",
"exportMode": "client",
"theme": "fusion"
},
"data": [
{
"label": "Jan",
"value": "420000"
},
{
"label": "Feb",
"value": "810000"
},
{
"label": "Mar",
"value": "720000"
},
{
"label": "Apr",
"value": "550000"
},
{
"label": "May",
"value": "910000"
},
{
"label": "Jun",
"value": "510000"
},
{
"label": "Jul",
"value": "680000"
},
{
"label": "Aug",
"value": "620000"
},
{
"label": "Sep",
"value": "610000"
},
{
"label": "Oct",
"value": "490000"
},
{
"label": "Nov",
"value": "900000"
},
{
"label": "Dec",
"value": "730000"
}
]
}<chart caption="Monthly Revenue" subcaption="Last year" xaxisname="Month" yaxisname="Amount (In USD)" numberprefix="$" canvasbgalpha="0" bgcolor="#DDDDDD" bgalpha="50" exportenabled="1" exportmode="client" theme="fusion">
<set label="Jan" value="420000" />
<set label="Feb" value="810000" />
<set label="Mar" value="720000" />
<set label="Apr" value="550000" />
<set label="May" value="910000" />
<set label="Jun" value="510000" />
<set label="Jul" value="680000" />
<set label="Aug" value="620000" />
<set label="Sep" value="610000" />
<set label="Oct" value="490000" />
<set label="Nov" value="900000" />
<set label="Dec" value="730000" />
</chart><html>
<head>
<title>My first chart using FusionCharts Suite XT</title>
<script type="text/javascript" src="https://cdn.fusioncharts.com/fusioncharts/latest/fusioncharts.js"></script>
<script type="text/javascript" src="https://cdn.fusioncharts.com/fusioncharts/latest/themes/fusioncharts.theme.fusion.js"></script>
<script type="text/javascript">
FusionCharts.ready(function(){
var chartObj = new FusionCharts({
type: 'column2d',
renderAt: 'chart-container',
width: '500',
height: '300',
dataFormat: 'json',
dataSource: {
"chart": {
"caption": "Monthly Revenue",
"subCaption": "Last year",
"xAxisName": "Month",
"yAxisName": "Amount (In USD)",
"numberPrefix": "$",
"canvasBgAlpha": "0",
"bgColor": "#DDDDDD",
"bgAlpha": "50",
//Enabling chart export
"exportEnabled": "1",
//Enabling client-side export
"exportMode": "client",
"theme": "fusion"
},
"data": [
{
"label": "Jan",
"value": "420000"
},
{
"label": "Feb",
"value": "810000"
},
{
"label": "Mar",
"value": "720000"
},
{
"label": "Apr",
"value": "550000"
},
{
"label": "May",
"value": "910000"
},
{
"label": "Jun",
"value": "510000"
},
{
"label": "Jul",
"value": "680000"
},
{
"label": "Aug",
"value": "620000"
},
{
"label": "Sep",
"value": "610000"
},
{
"label": "Oct",
"value": "490000"
},
{
"label": "Nov",
"value": "900000"
},
{
"label": "Dec",
"value": "730000"
}
]
}
}
);
chartObj.render();
});
</script>
</head>
<body>
<div id="chart-container">FusionCharts XT will load here!</div>
</body>
</html>How do you know if the export was done on the client-side? The images below show you the difference:
| |
|---|
 |
| |
|---|
 |
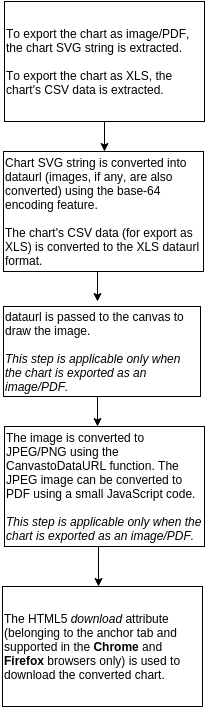
The graphic below details the steps that are involved in a client-side export:
{:refdef: style="margin-left: auto; margin-right: auto; width: 6em"}
 {: refdef}
This feature uses the HTML5 API; therefore, it is important that modern browsers include support for:
- Canvas
- BLOB (Binary Large OBject, or large binary data as a single entity)
- base-64 encoding and decoding
These technologies perform the necessary conversion from SVG to the required format (the rendered charts in the JPG, PNG, or PDF formats, or the chart data (in the XLSX format). Using the HTML5 API helps to overcome the earlier browser functionality limitations that hampered the implementation of this feature.
FusionCharts supports exporting chart data as XLSX starting v3.11.0. Select Download as XLSX from the menu in the top-right corner of the chart.