Do you tell compelling stories with your data?
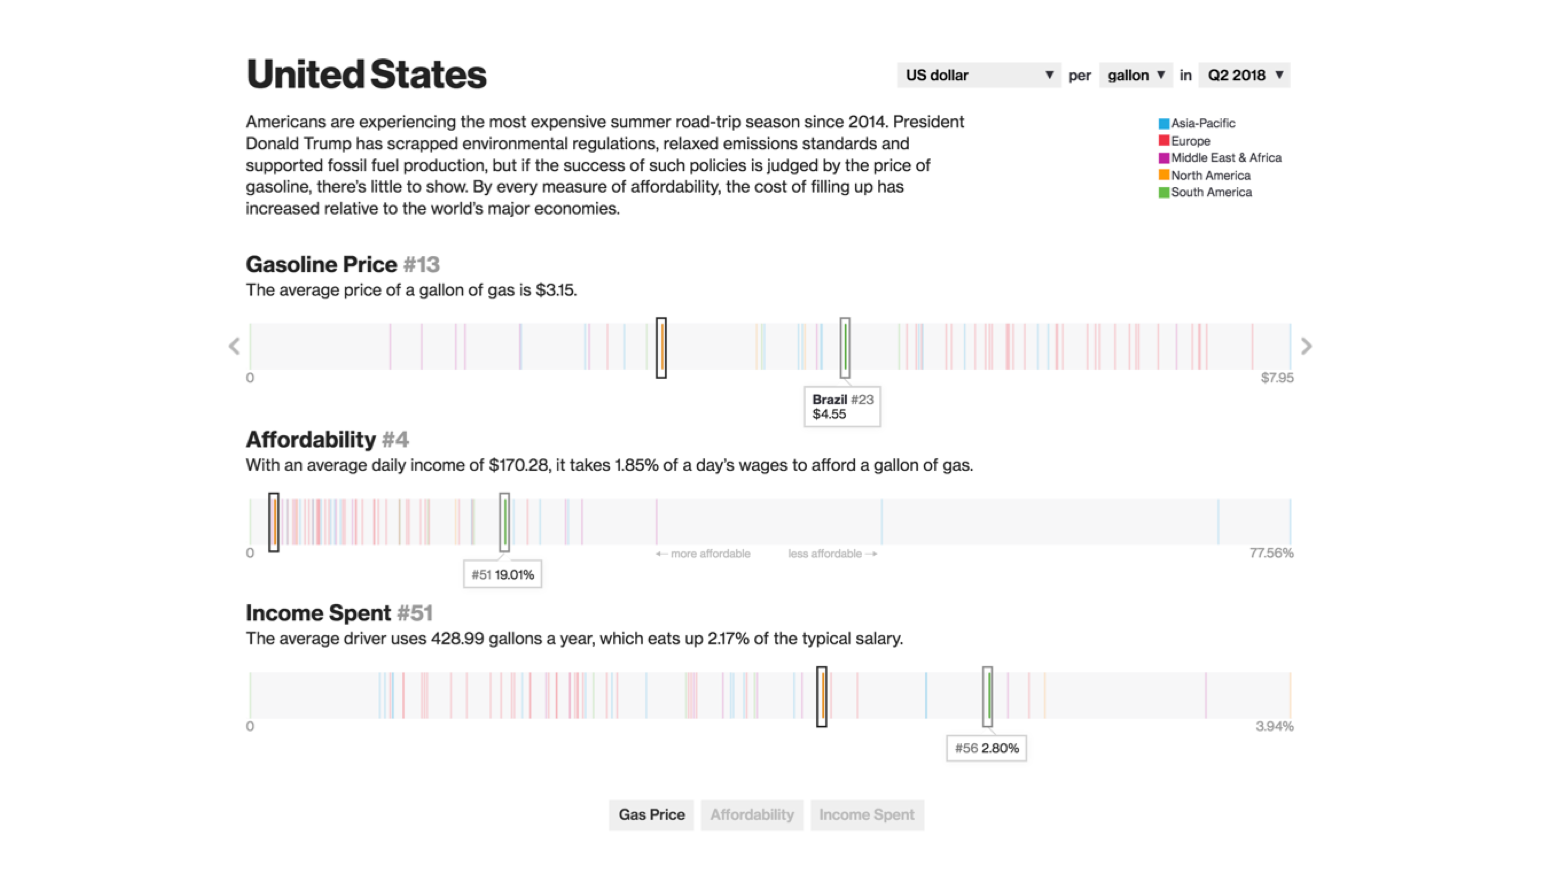
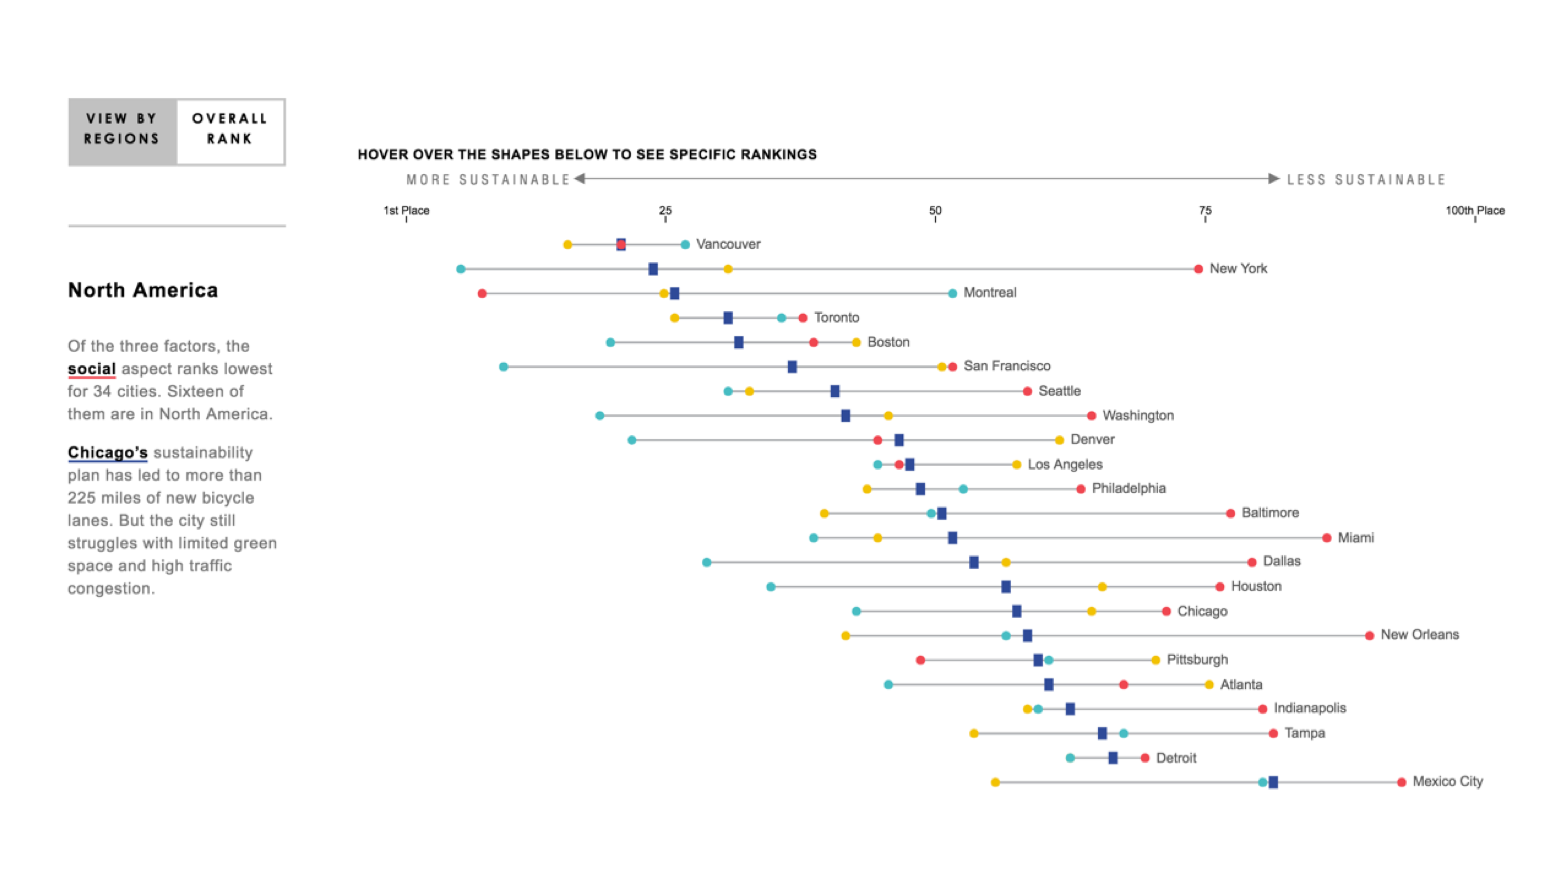
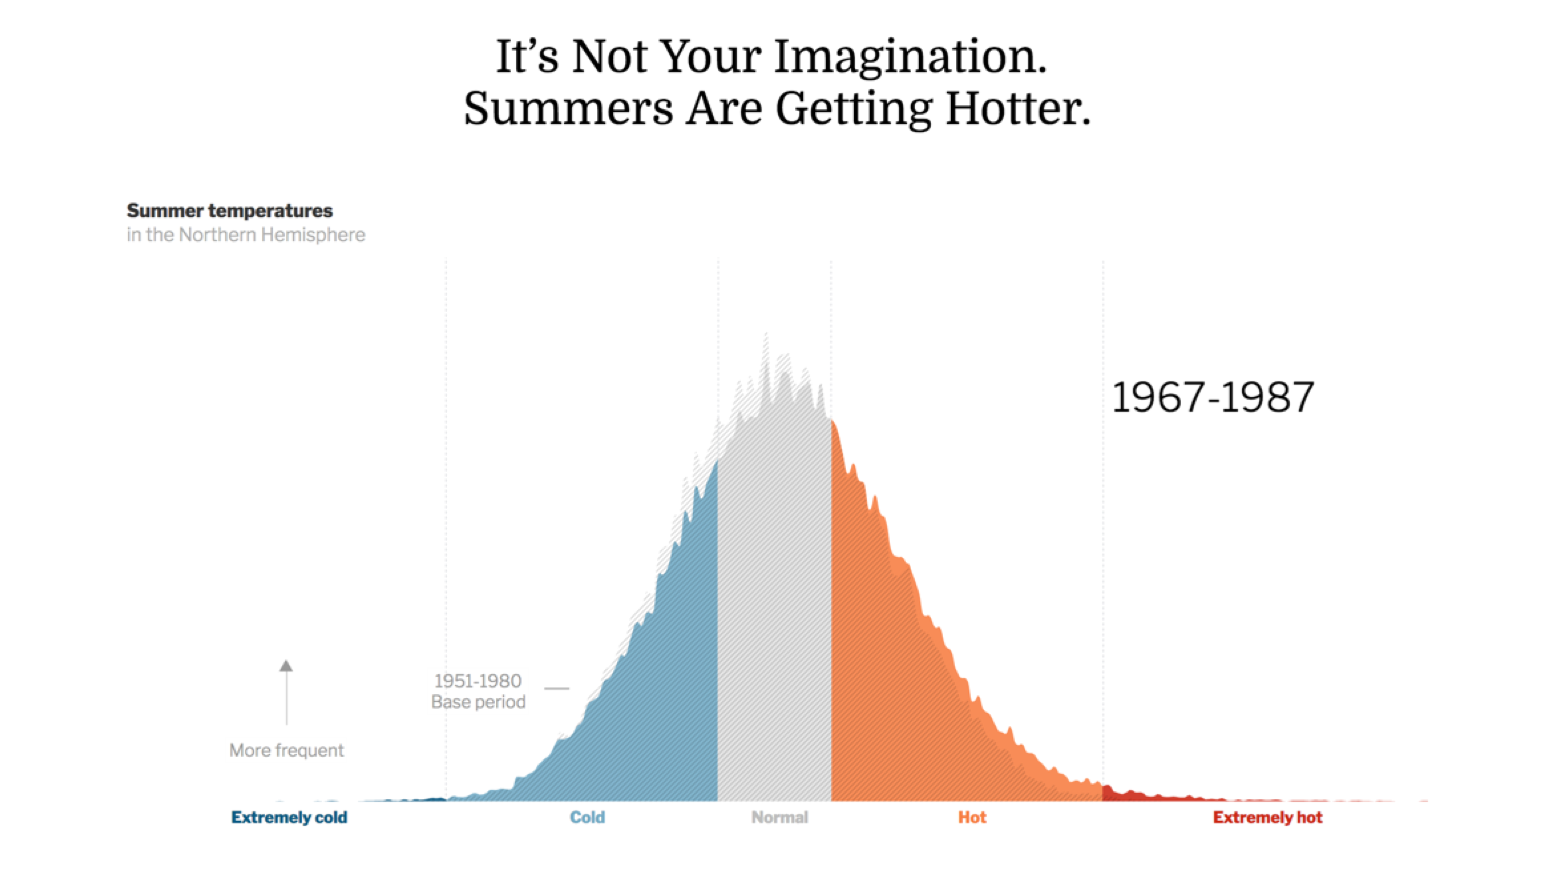
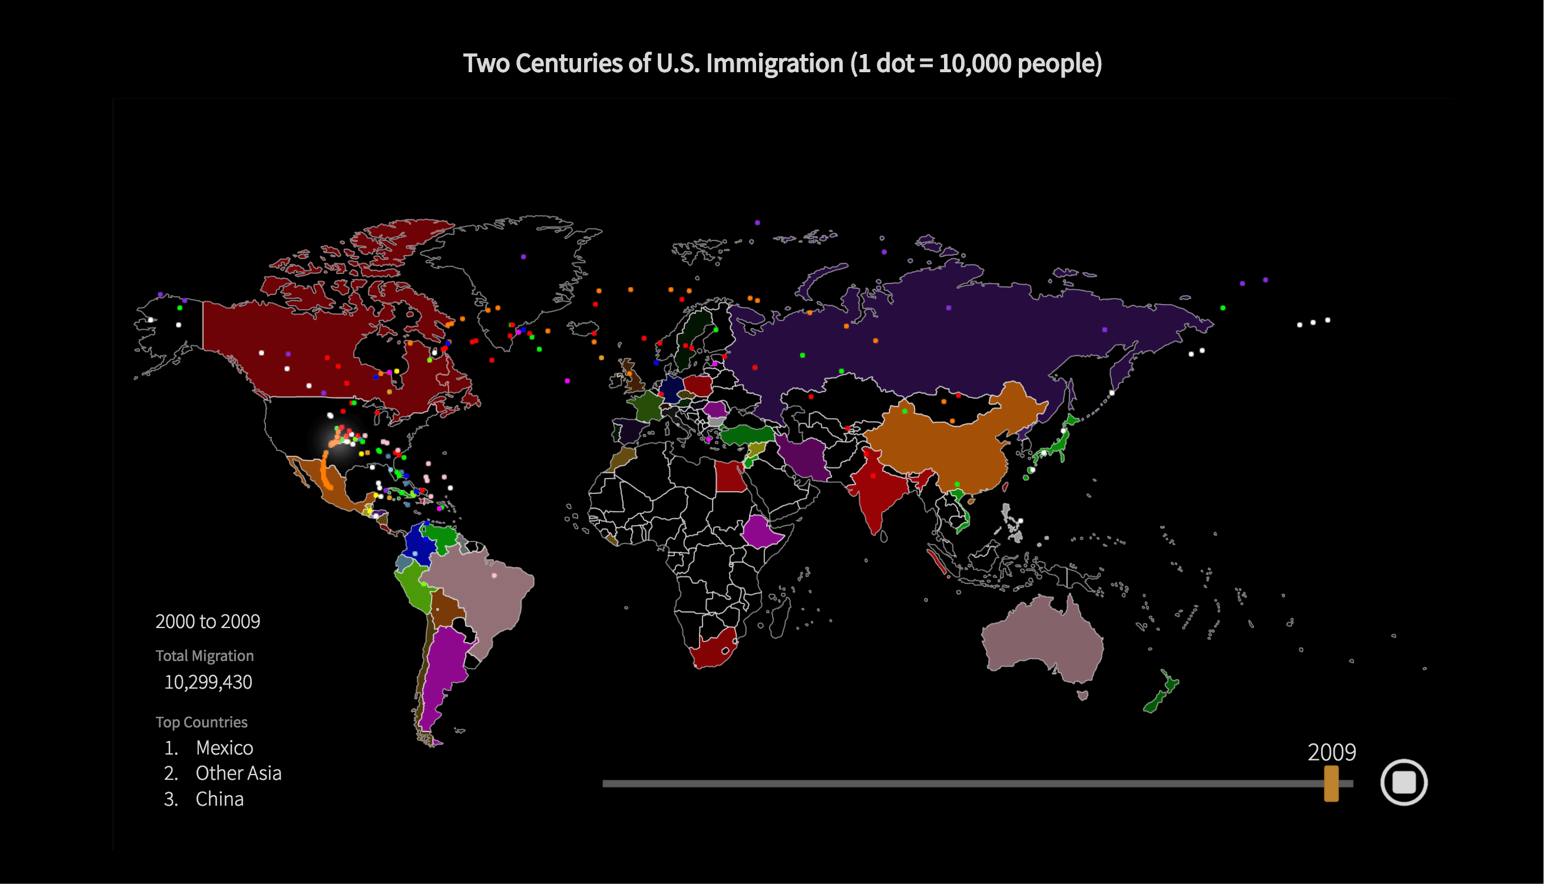
Narratives can summarize your data and make it memorable for all users. The FusionCharts product family can effectively communicate such narratives using the underlying data to tell compelling stories. Data stories use a series of linked visualizations to engage people and help them delve deeper into your data. Are you looking to build such interactive visualizations?
Data Stories with FusionCharts
Our approach
At FusionCharts, though we are no experts in data-driven journalism, we know how to communicate data and simplify understanding using visualizations. In fact, we have been doing it for over 16 years and have served 28,000+ customers across 118 countries.
People across the globe have been doing some incredible work around data-driven storytelling. We tip our hats to their amazing work which continually inspires us!
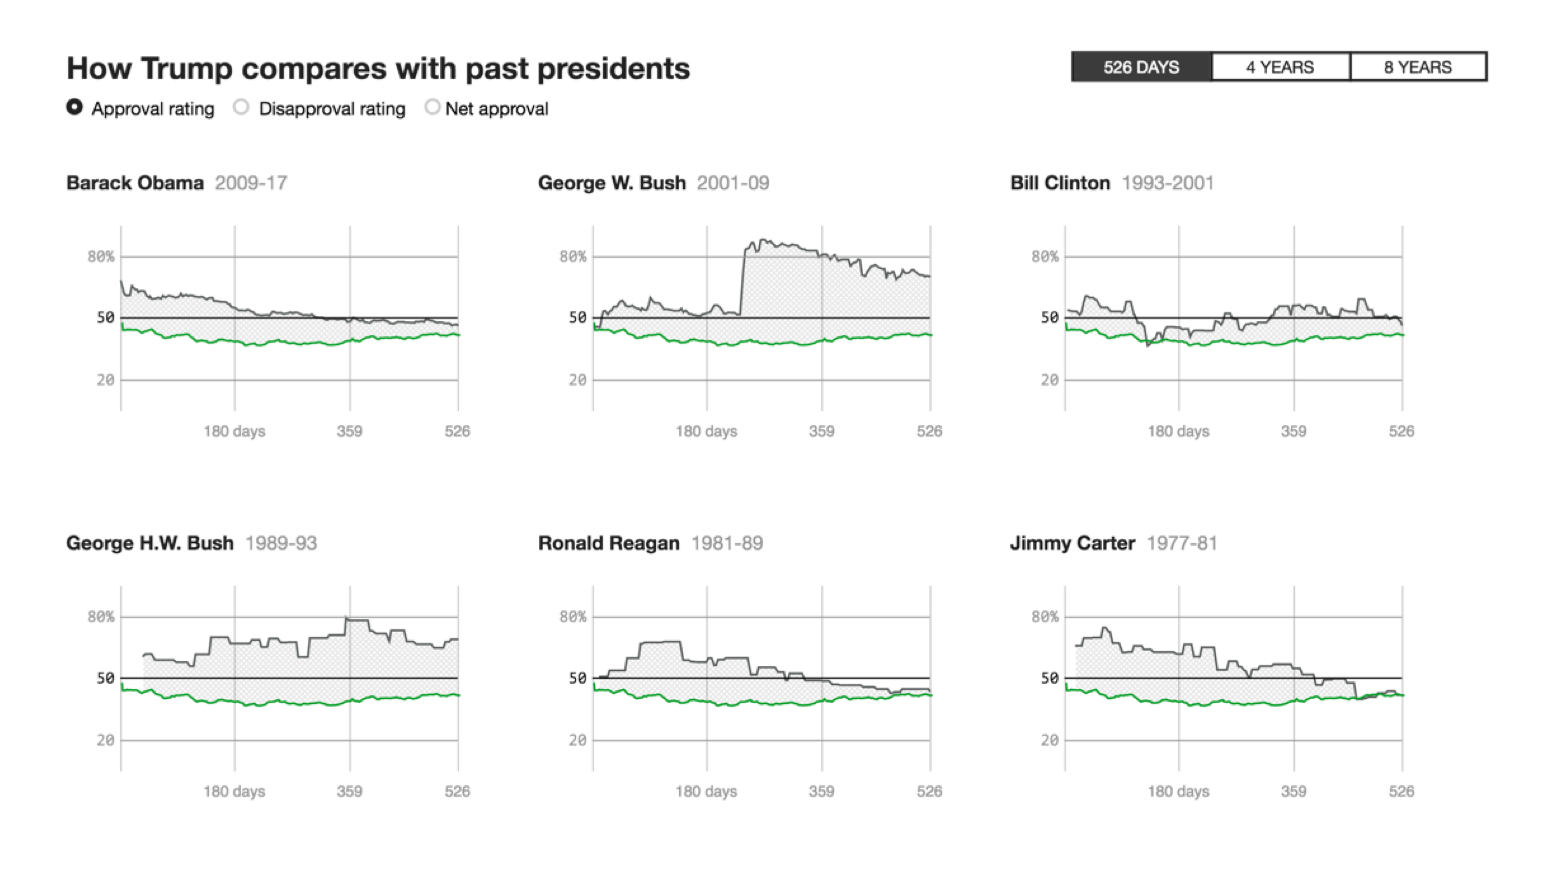
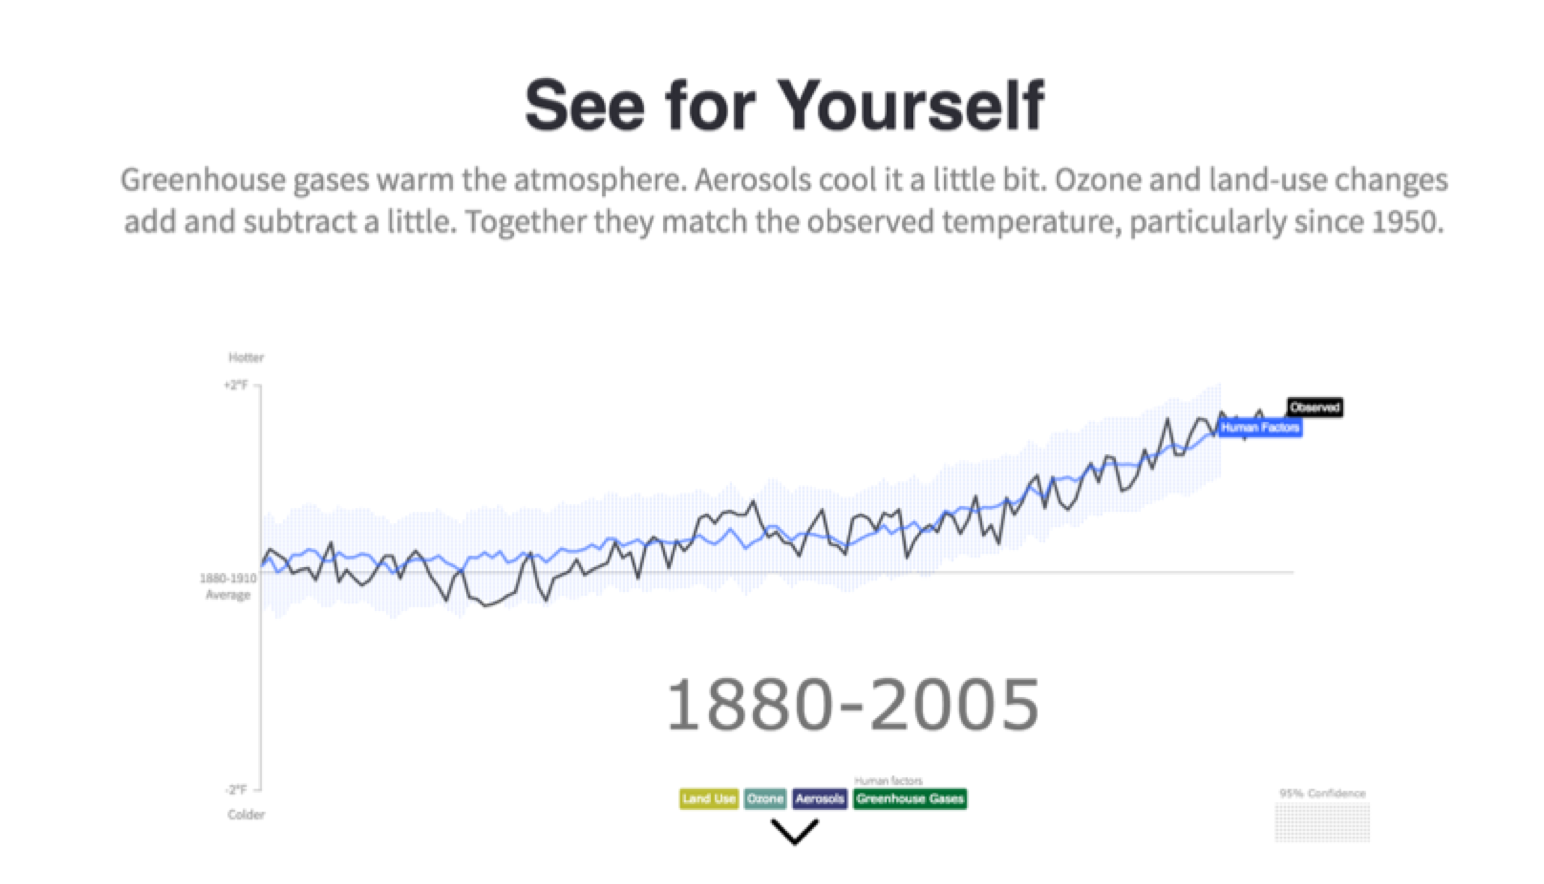
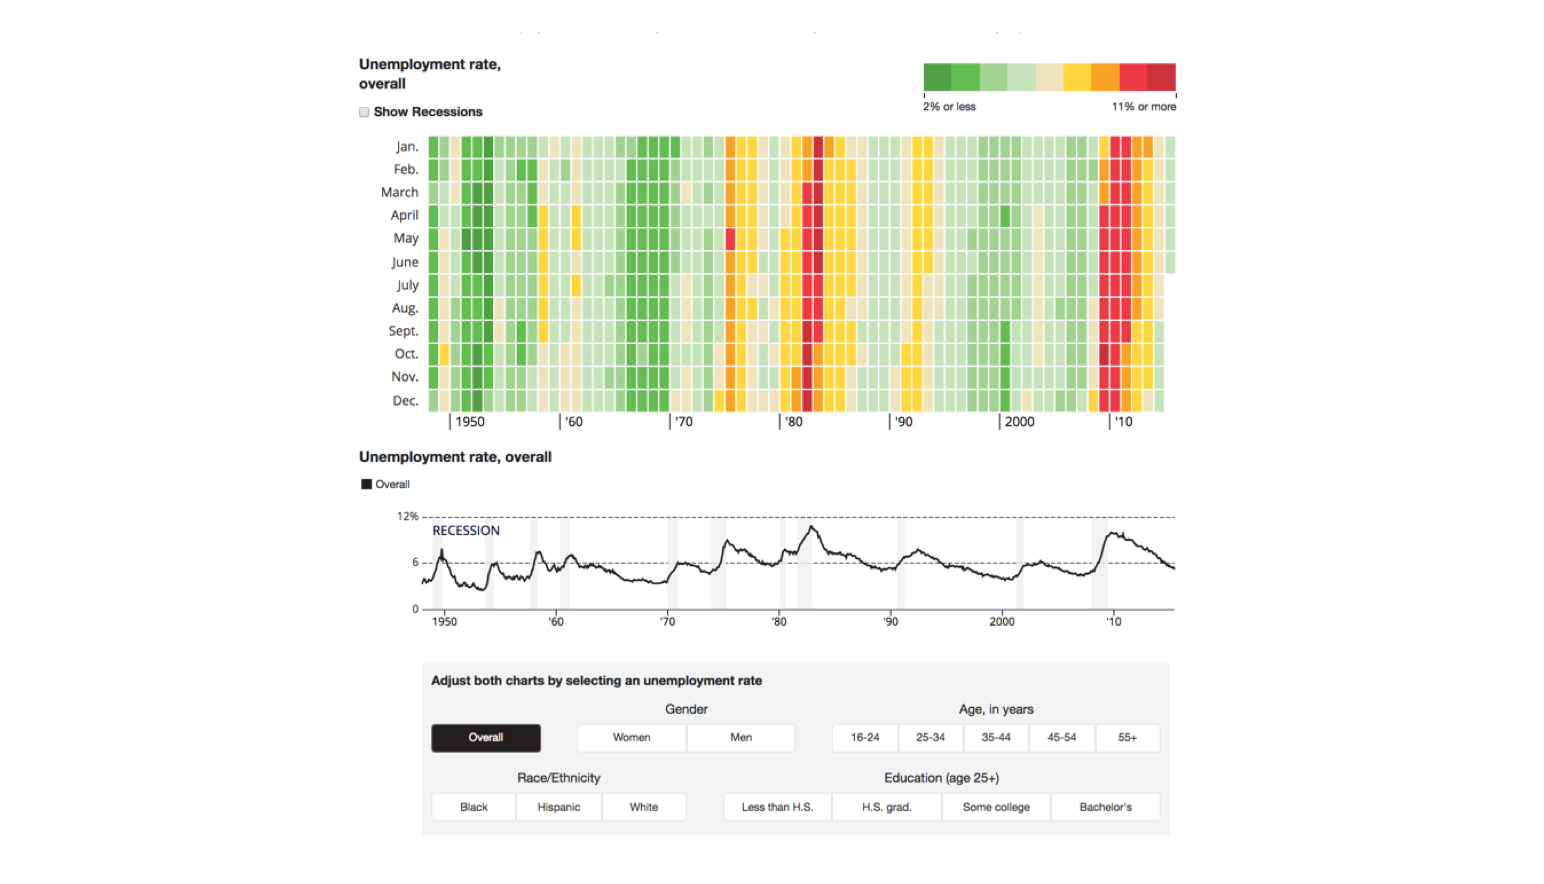
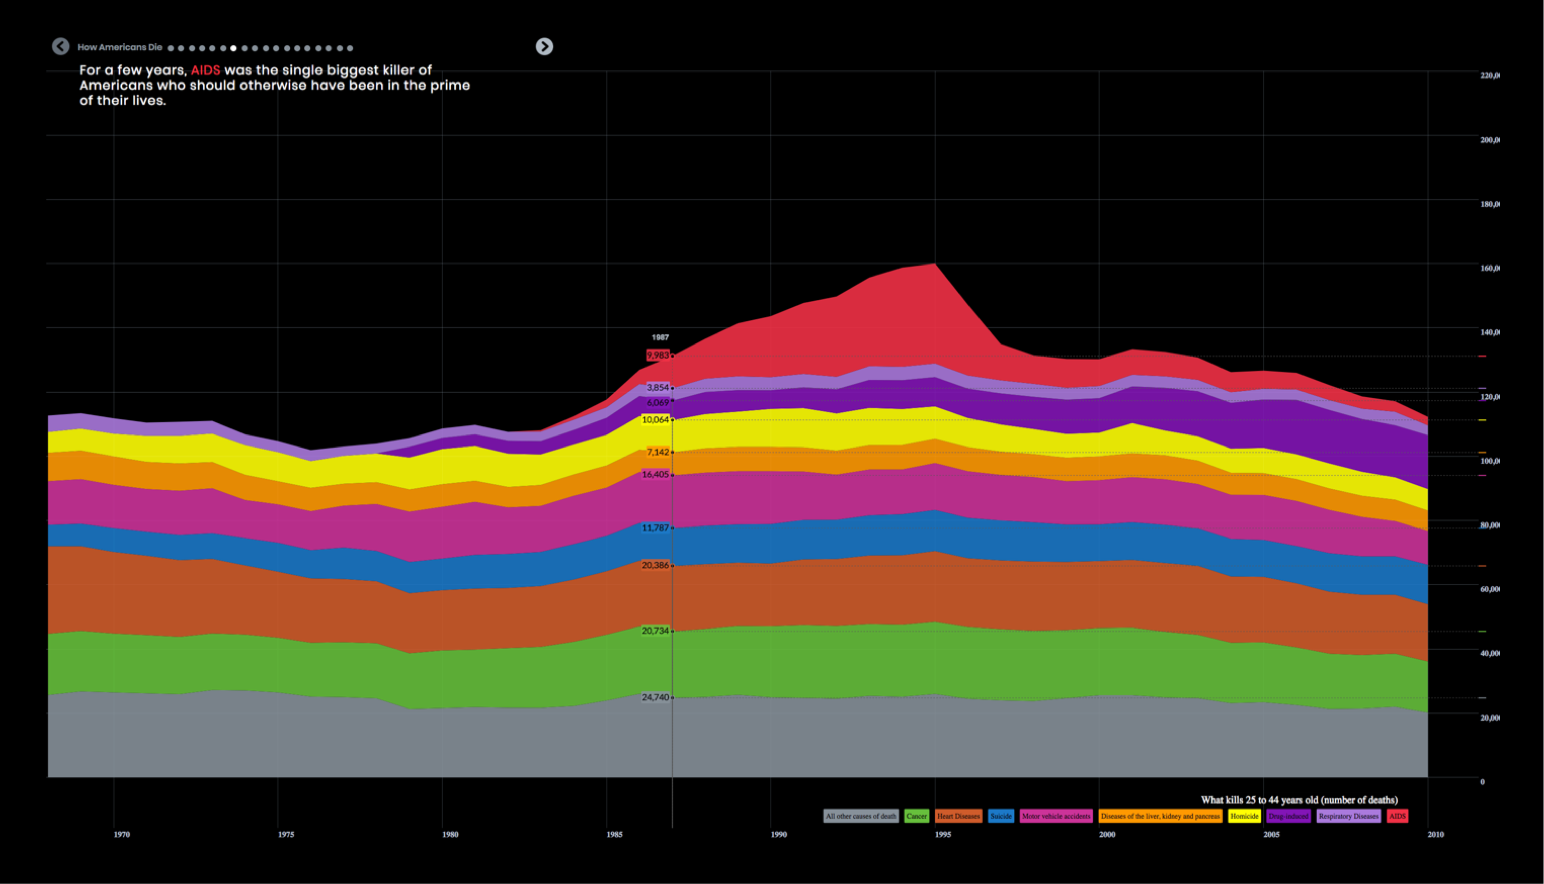
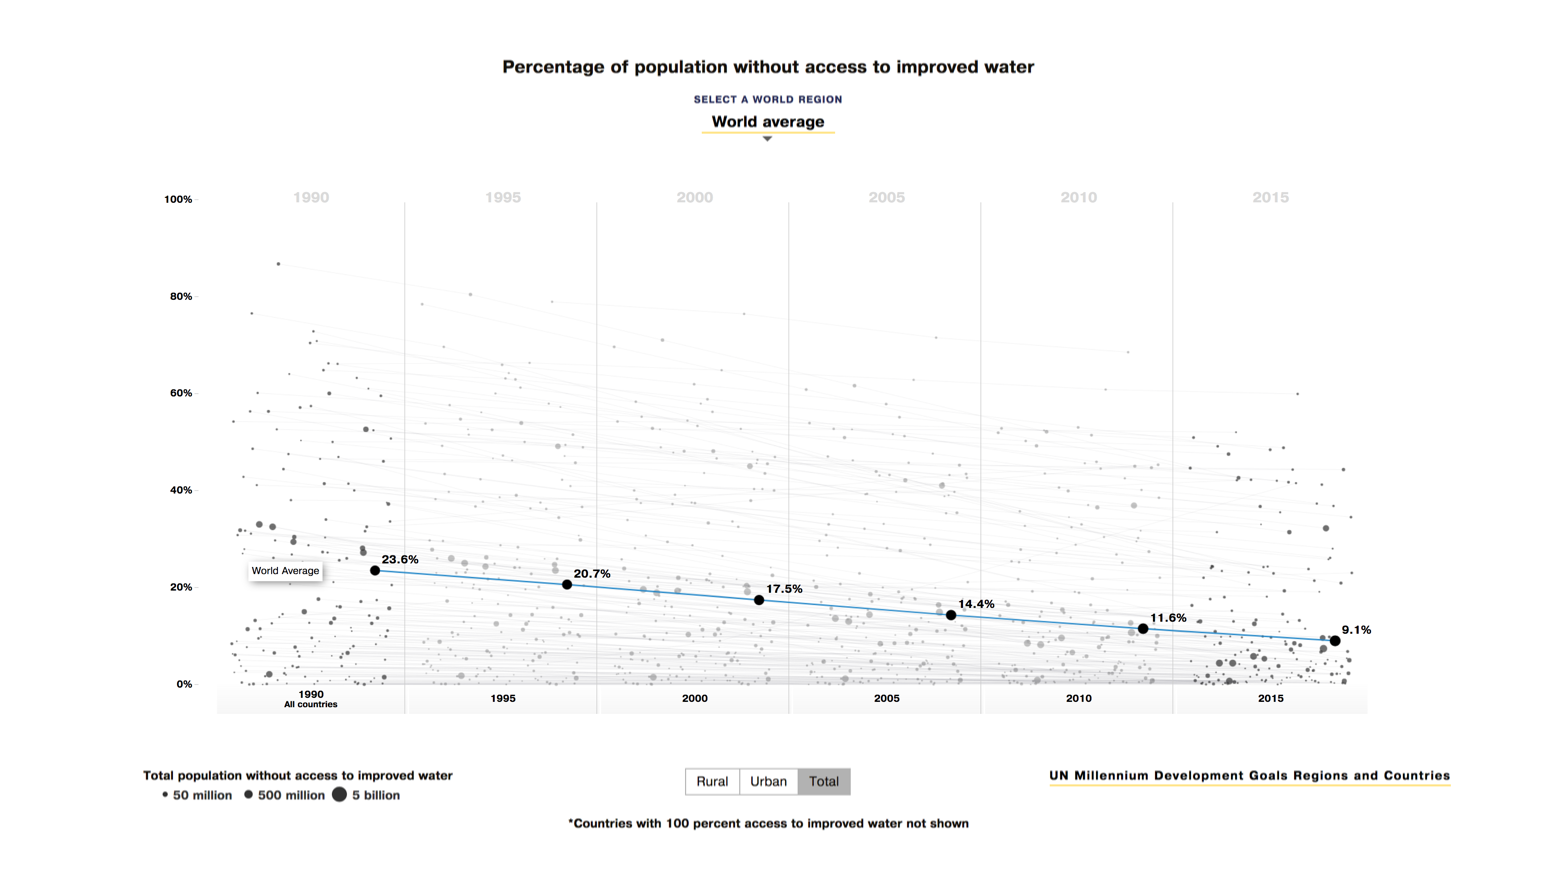
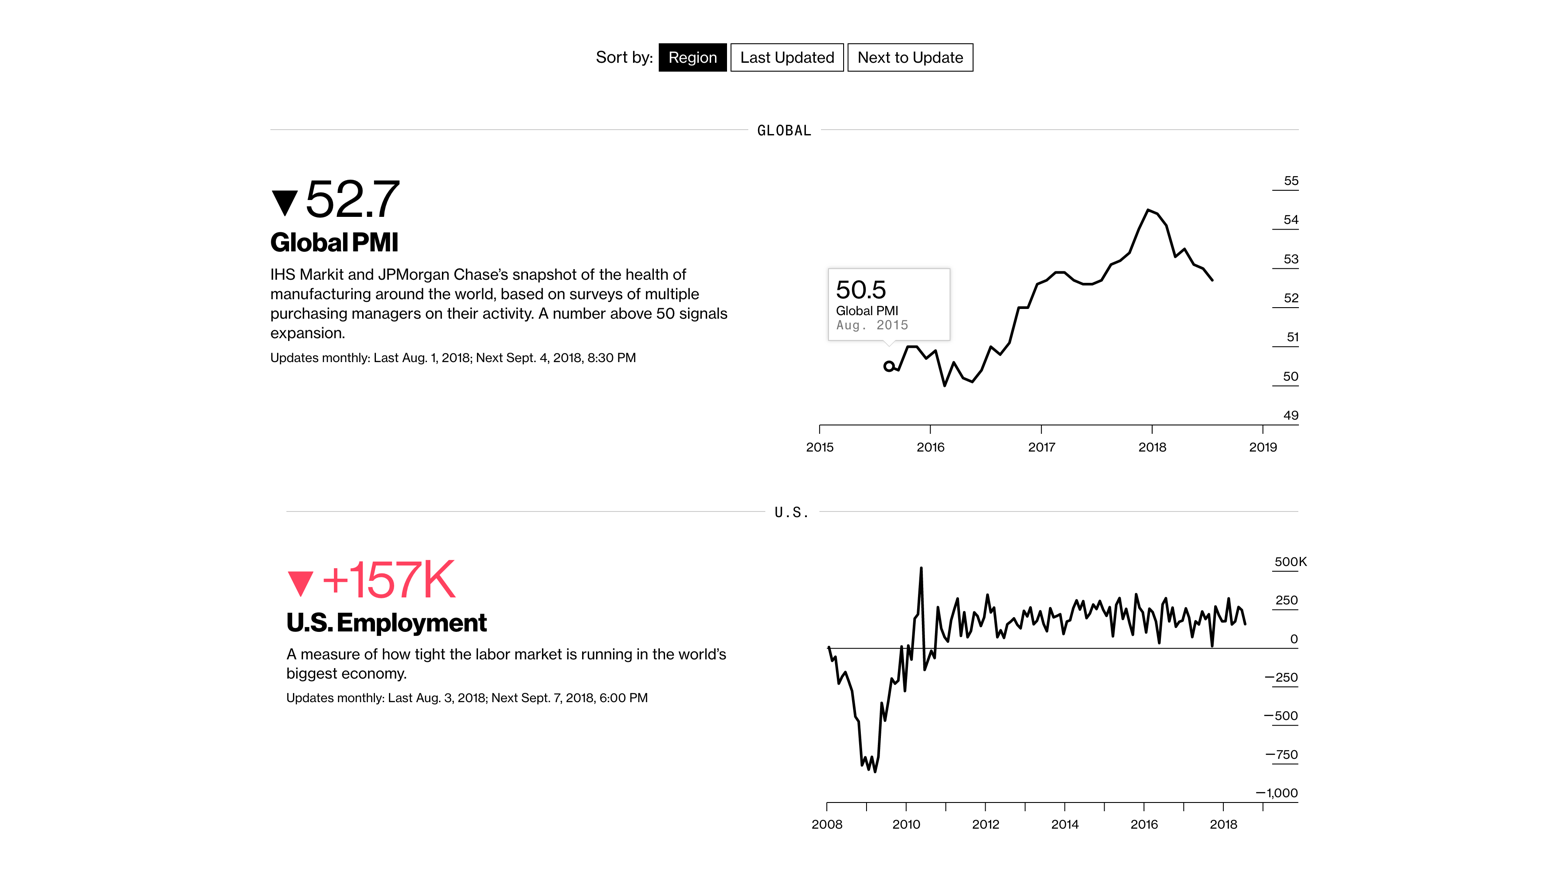
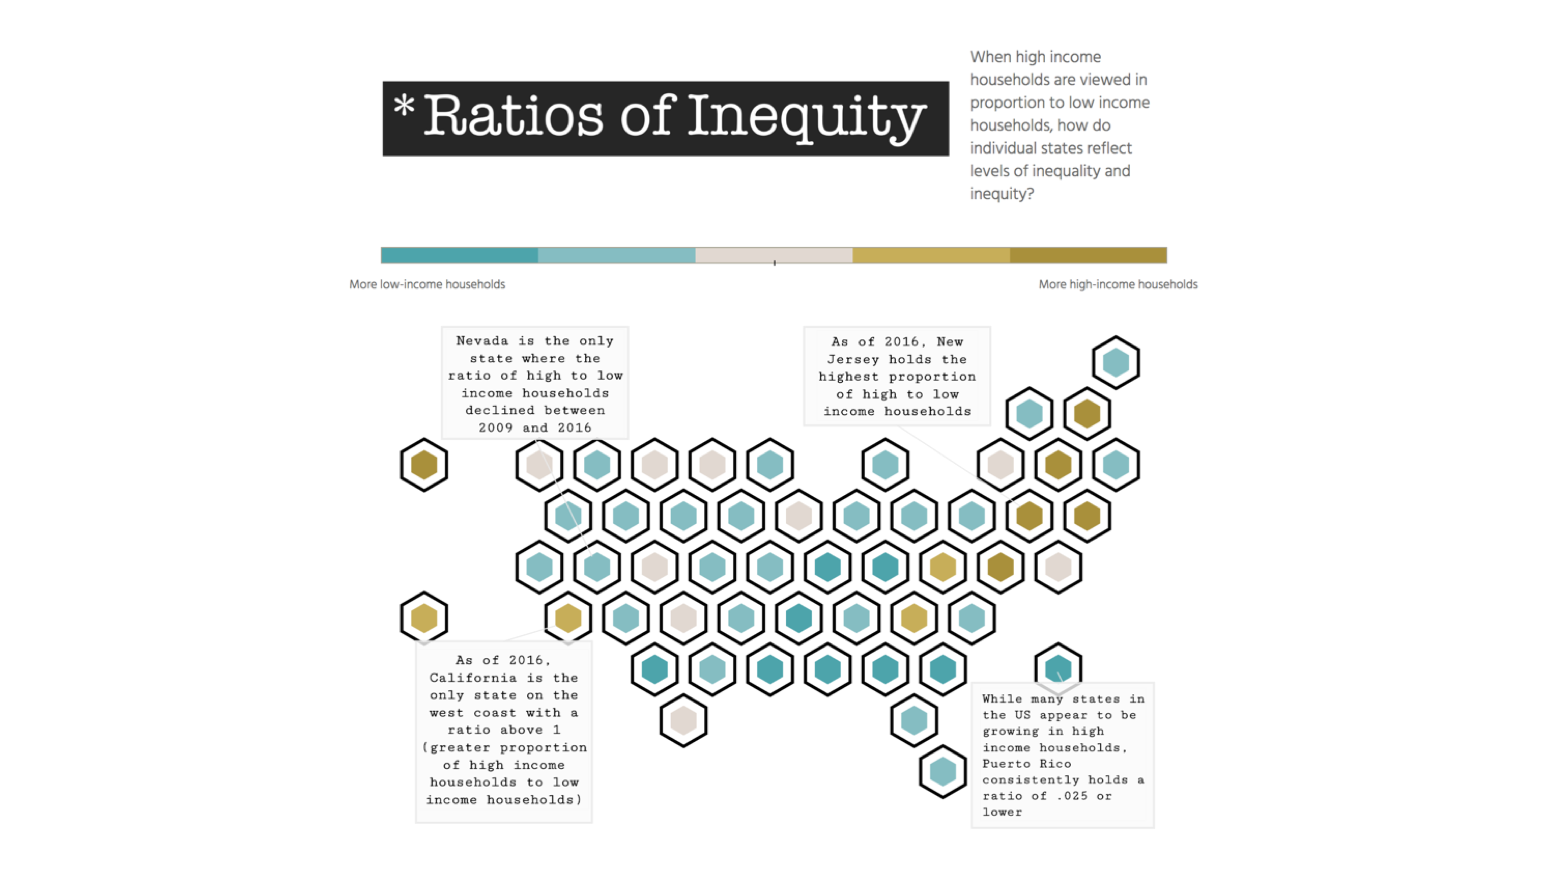
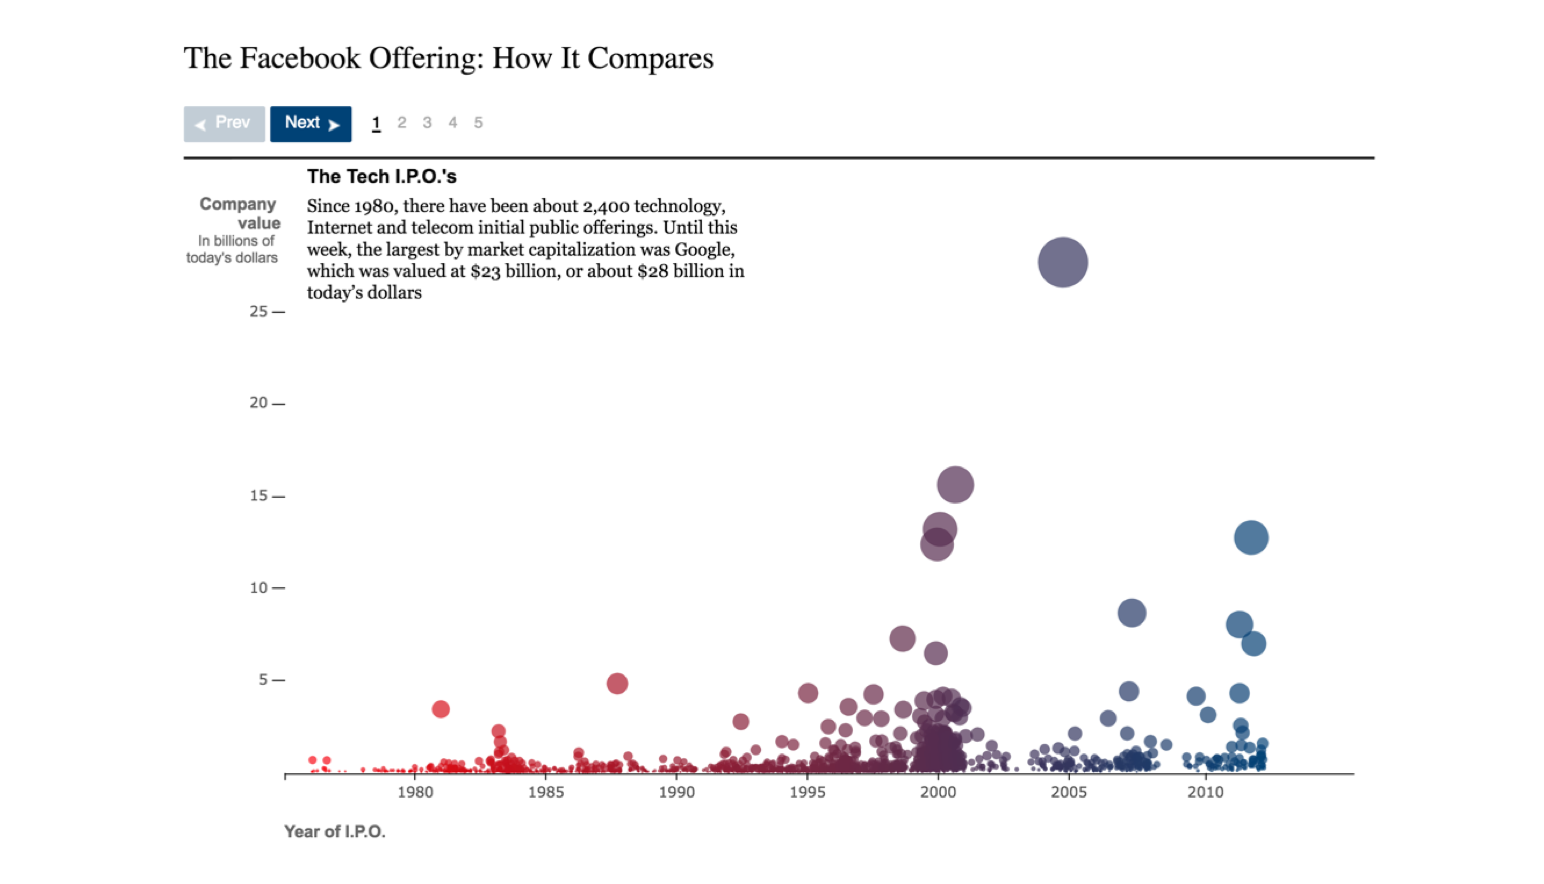
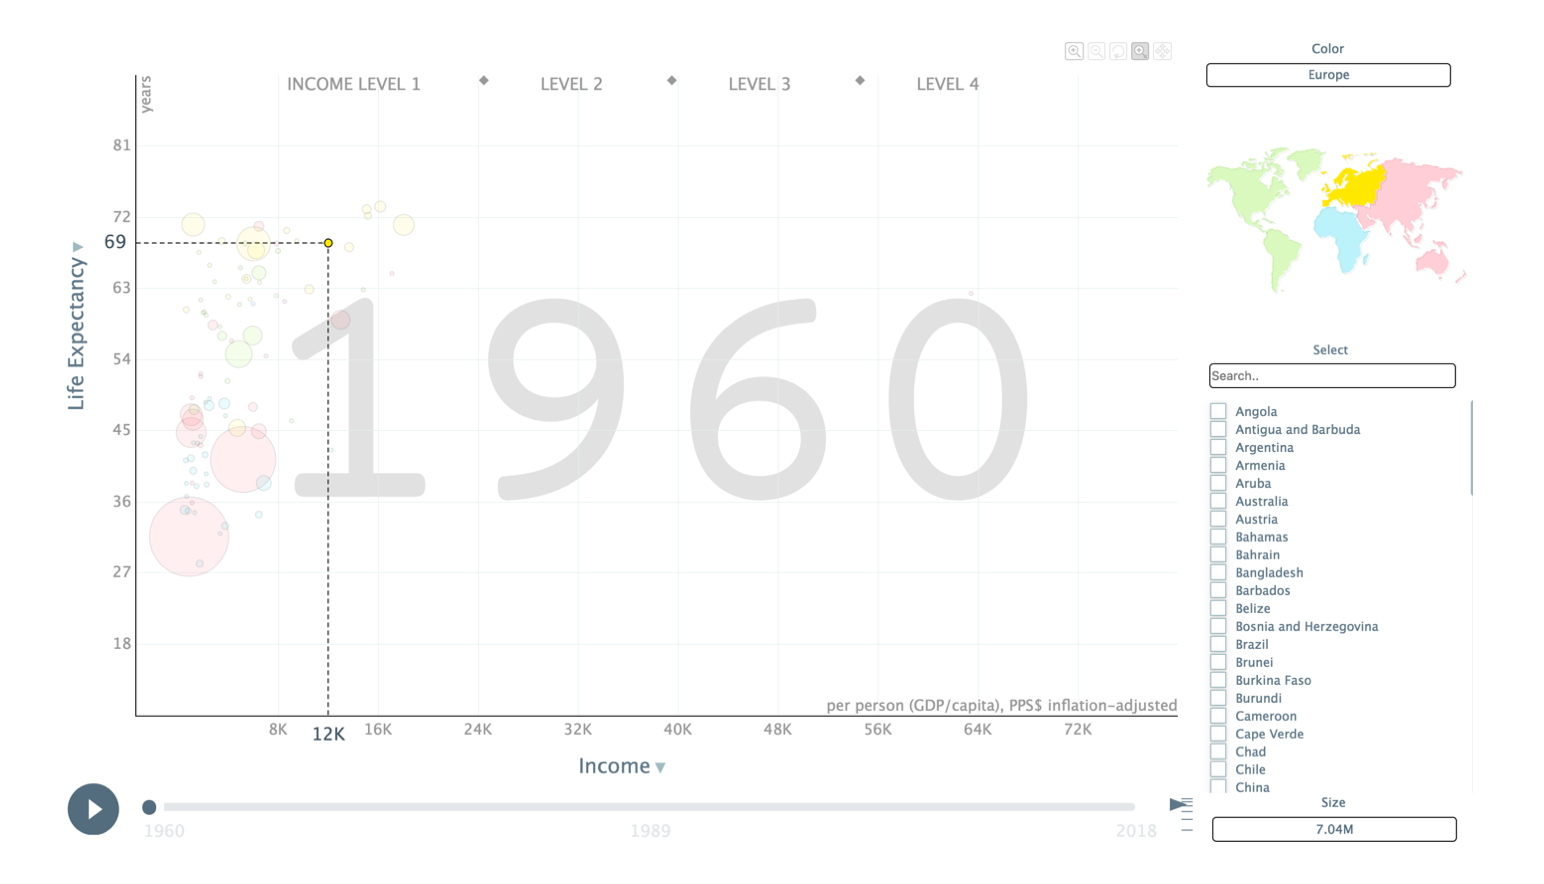
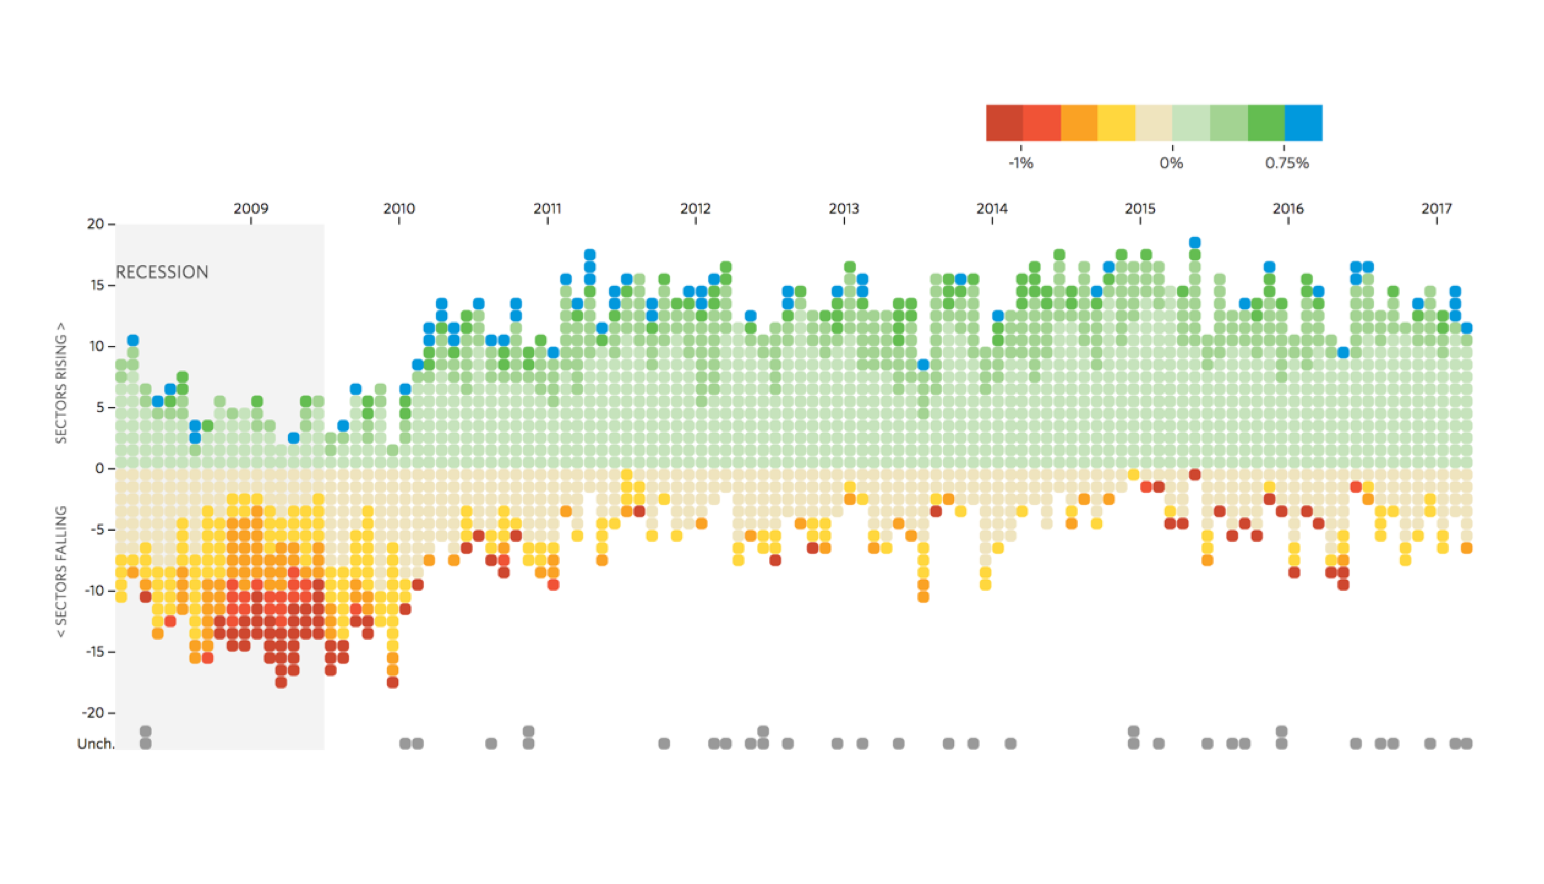
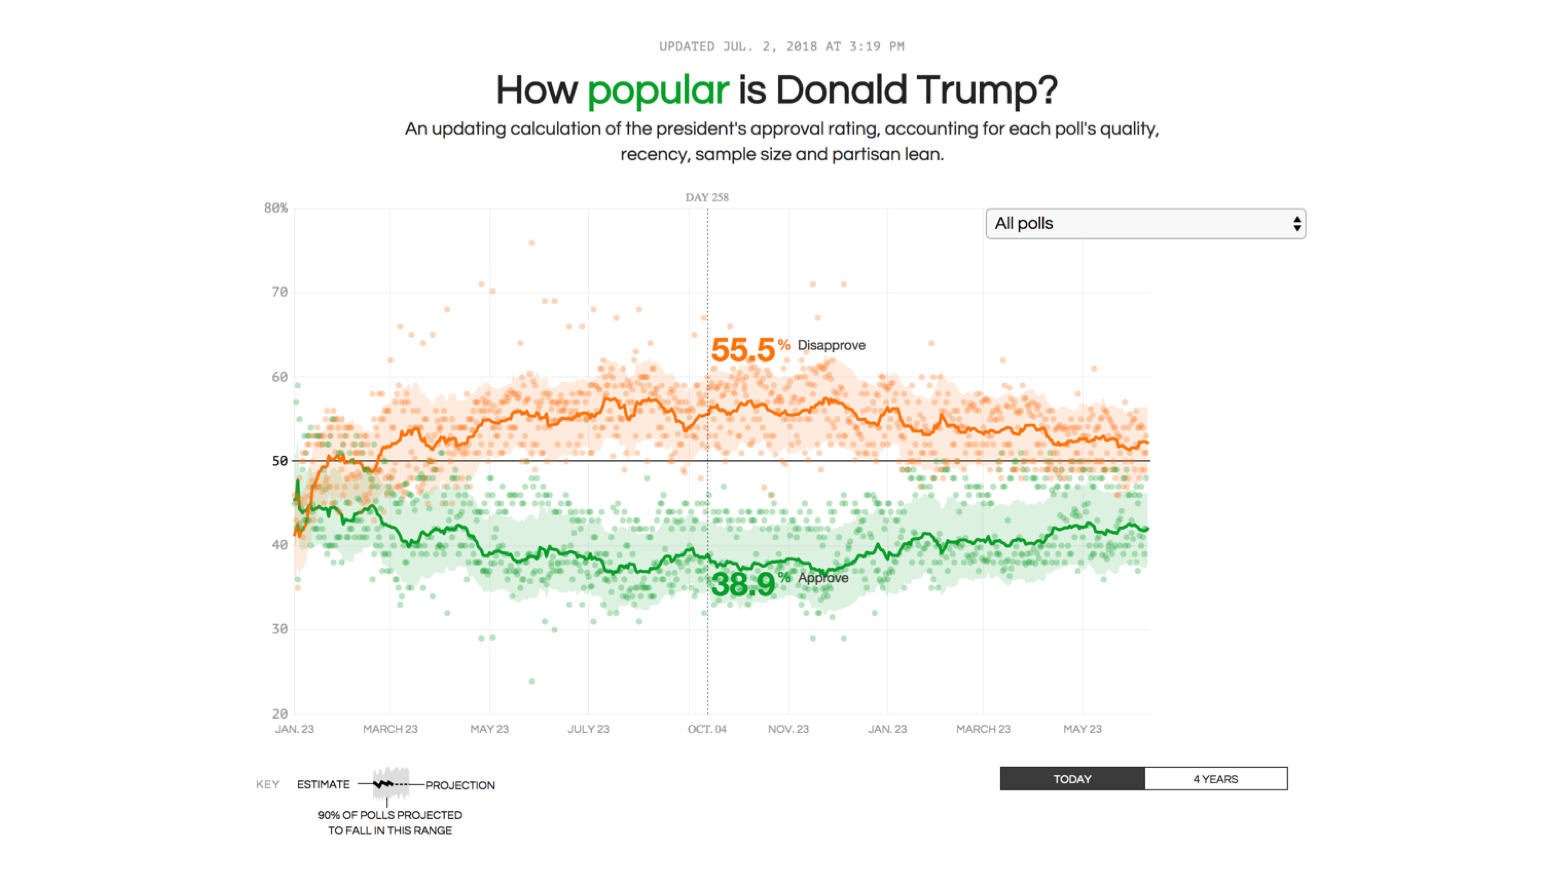
Our goal was to showcase the power of FusionCharts and how easily the FusionCharts Suite can be used to create such data stories. We selected the most compelling data stories available and recreated them using our product family. The stories showcased are by no means exhaustive, but they will give you a sense of FusionCharts library’s capabilities. Beyond the simple world of JavaScript charting, it can be used to tell enticing data-driven stories. Be the master of your data and narratives! Use our library to present engaging and informative data stories.
Want us to build a Data Story for you?
We can plug in your data into our existing data stories, or customize the template for your needs, or even build a completely new one. We would love to talk to you!
