Conceptualizing an effective business dashboard

A business dashboard is a multi-layered application, built on a business intelligence and data integration infrastructure that allows organizations to monitor, analyze and manage business process more effectively. This definition suggests that a dashboard is an application that is wired to the organization’s database/ERP system from where it draws data and presents it in a meaningful way. The fact that a dashboard is multi-layered implies that it presents different hierarchical views of data. Using a dashboard; executives can monitor, analyze and manage a business process.
Conceptualizing a business dashboard is a complex process. It requires an in-depth knowledge of the business processes involved and deep technical knowledge of how to go about implementing it too. But another aspect that is often overlooked is an understanding of how the end user will interact with the dashboard. A poor understanding of that leads to poorly designed dashboards, which hinders decision-making, and kills the very purpose of the dashboard.
With this post, we aim to equip you with a basic understanding of how end users interact with a dashboard and more generally, how you can conceptualize your business dashboards better.
How do people interact with a dashboard?
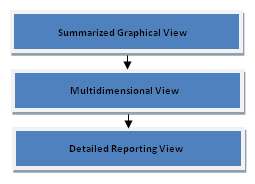
Dashboards are all about visualizing data. According to Wayne Eckerson, the director of research and services for TDWI (The Data Warehousing Institute) and a leading authority on business dashboards - business dashboards should allow visualization of data at three levels:
- Summarized view
- Multi-dimensional view
- Detailed view
Prior to explaining the three layers of data presentation, we’ll give you an insight into how requirement of data varies depending on the circumstance. In fact, the need for layered presentation of data is born out of the fact that people don’t want all the data at one time. What they do want is the right piece of information – just when it is needed.
As suggested in the definition above, a business dashboard should let users monitor, analyze and manage business processes.
Summarized view
The summarized graphical view of the dashboard allows a user to monitor a business process. In case there is a problem in the process flow, the user drills-down to the next level which is the multidimensional layer.
Multi-dimensional view
The multidimensional layer provides a much detailed view of data, thereby allowing the user to determine the cause of the problem. Sometimes, the cause of the problem cannot be detected in the multidimensional layer – so the user has to drill-down further to the detailed view layer.
Detailed view
The detailed view layer provides details of individual transaction and from here the user can easily identify the fundamental cause of the problem.
 Conceptualizing an effective business dashboard
  The Ten Commandments of Designing an Information Dashboard
  Creating Responsive Dashboards with Interactive Charts and Bootstrap
 Introduction to Collaboration Dashboard
 Cleartrip Tracks Payment Failure in Milliseconds
 Behind the scenes of Server Density’s dashboard design
 Twitter’s New Analytics Dashboard


