Saas Metrics Dashboard: Metrics, KPIs & Features

The SaaS dashboard by FusionCharts helps a SaaS company track and monitor important metrics of an organization. A comprehensive visibility of the metrics pertaining to users, revenue, cost, and growth is available to the viewer. Simple use of KPIs and charts make the understanding of the metrics very easy for a normal user.Using the same data source and format, easily create your FusionGrid using FusionChart data.
This sample dashboard is built using FusionCharts Suite XT, which needs a license for commercial use.
Key features
- Quick visibility of important metrics of a SaaS company
- See the growth in percentage of all the metrics
- Monthly performance of metrics like, revenue, CAC, ARPU, etc
- Ability to toggle between metrics of last 3 years
- Monitor the progress made towards each goal
- See and browse the detailed data with FusionGrid
- FusionGrid shows data using the same data source as FusionCharts
FusionCharts products used
Technologies used
Metrics & KPIs to Include on Your SaaS Metric Dashboard
1. Product Signups
Tracking product signups is essential for understanding your SaaS business's growth. By monitoring this metric, you can assess the effectiveness of your marketing efforts and identify which channels are driving the most signups. Analyzing trends in product signups over time can also help you identify any potential issues with your onboarding process and make necessary adjustments to improve conversion rates.2. Conversion Rate
The conversion rate measures the percentage of visitors who take a desired action, such as signing up for a trial or purchasing a subscription. This metric is crucial for optimizing your sales funnel and identifying areas where prospects may drop off. By analyzing conversion rates at each stage of the customer journey in the Saas metrics dashboard, you can identify opportunities for improvement and implement strategies to increase conversion rates.3. Feature Adoption Rate
The feature adoption rate measures how quickly customers adopt new features or updates to your SaaS product. Monitoring this metric can help you assess the effectiveness of your product development efforts and identify which features are most valuable to your customers. Analyzing feature adoption rates allows you to prioritize future development efforts and allocate resources more effectively.4. Customer Lifetime Value (CLTV)
Customer lifetime value (CLTV) measures the total revenue a customer is expected to generate over their relationship with your company. Monitoring CLTV is essential for understanding the long-term value of your customers and identifying opportunities to increase customer retention and loyalty. You can make more informed decisions about customer acquisition and retention strategies with the help of this metric on Saas dashboard.5. Net Promoter Score (NPS)
The Net Promoter Score (NPS) measures customer satisfaction and loyalty by asking customers how likely they are to recommend your product or service to others. Monitoring NPS can help you gauge overall customer sentiment and identify areas where you may need to improve the customer experience. By tracking changes in NPS over time, you can assess the impact of your efforts to improve customer satisfaction and loyalty.6. Active Users DAU, WAU, MAU
Active users, including DAU, WAU, and MAU, measure the number of users who engage with your product within a specific time frame. Here, we have discussed in brief about each of them:- MAU (Monthly Active Users): It refers to the number of unique users interacting with or engaging with your app in a month.
- WAU (Weekly Active Users): This refers to the number of users who engage on the app within a week.
- DAU (Daily Active Users): These are the number of users who explore your platform at least once a day.
7. Average Revenue Per Unit (ARPU)
Average Revenue Per Unit (ARPU) measures the monthly revenue generated per customer or user. It provides an understanding of the overall health of your SaaS business and identifies opportunities to increase revenue. By including ARPU in your SaaS metrics dashboard, you can identify trends in customer spending behavior and implement strategies to upsell or cross-sell additional products or features. ARPU is calculated as total revenue divided by the number of subscribers, users, or units.8. LTV/CAC Ratio
The LTV/CAC ratio compares a customer's lifetime value to the cost of acquiring that customer. Monitoring this ratio is essential for assessing the efficiency and effectiveness of customer acquisition efforts.9. Churn Rate
Churn rate, better known as "the rate of attrition or customer churn," is when customers stop doing business with an organization. This could happen either by canceling their subscriptions or stopping the use of a product during a given period.10. Monthly Recurring Revenue (MRR)
Monthly Recurring Revenue (MRR) measures the total revenue generated from monthly subscription fees. Monitoring MRR over Saas metrics dashboard is essential for understanding the overall health of your business and forecasting future revenue.- New MRR This is the monthly recurring revenue that brand-new customers generate.
- Expansion MRR Also known as an upgrade, expansion MRR represents the additional monthly recurring revenue from existing customers. It can result from upsell or cross-sell.
- Churn MRR The amount of revenue that was lost due to customers downgrading or canceling.
- Net New MRR After calculating the new, expansion, and churn MRR, whatever result you get is net new MRR.
How to get started with this dashboard
Environment Setup
- Make sure you have Node JS >= 8.10 and npm >= 5.6
Project Files Setup
- Create a folder and extract the zip
- Navigate to the extracted folder in terminal
- Run the following command to install the dependencies
npm installornpm i - Start the server using below command
npm run start - Open URL http://localhost:3000/ into browser
Similar Dashboards

Technology Dashboard
The technology dashboard by FusionCharts shows the trend of popular technologies like React, Angular, Vue and Ember in terms of quality, pop...
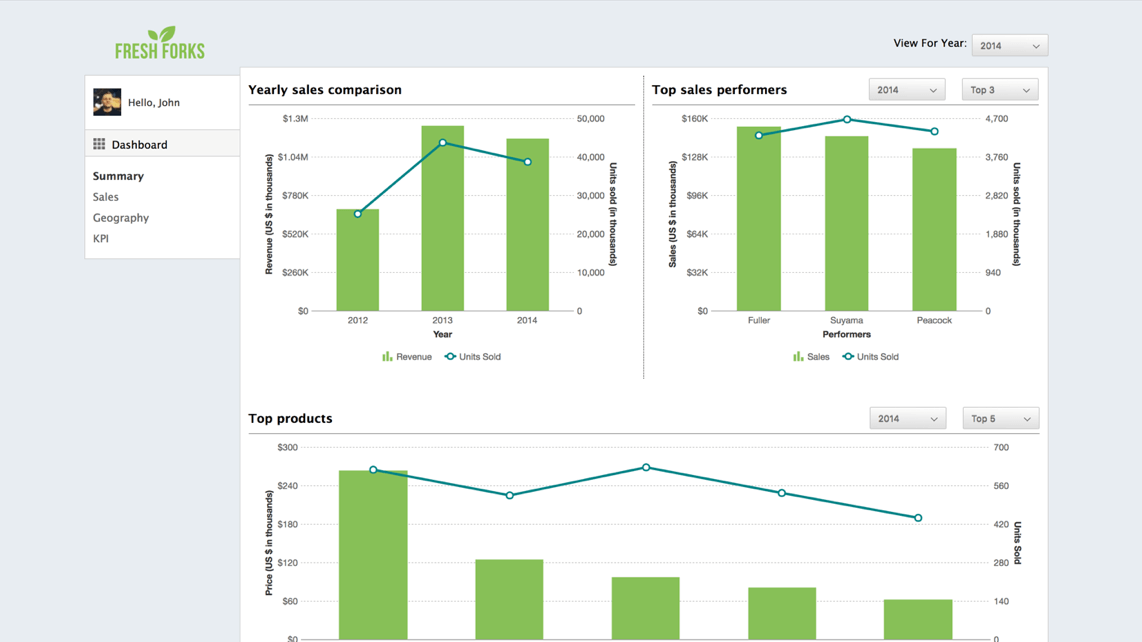
Sales Managemnt Dashboard
View important sales numbers with our Sales Management Dashboard. Log in with a unique user id & password to gain access to key company info...
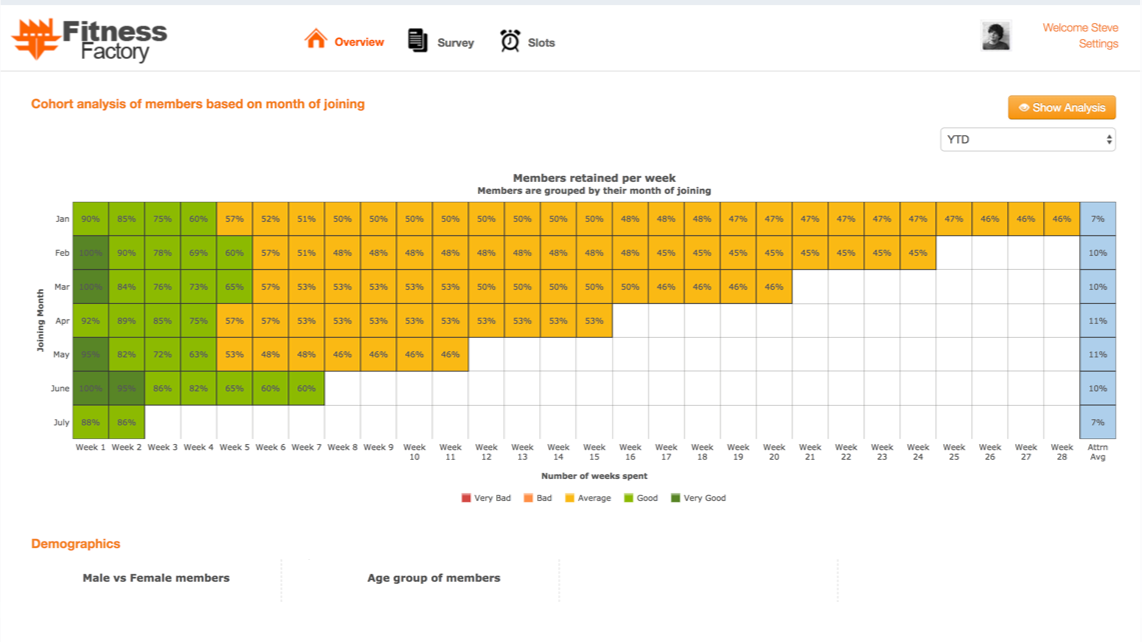
Membership Monitoring Dashboard
Analyze attrition & retention rates at your business, and understand member demographics, preferred visit times, campaign impacts, and more.
Frequently Asked Questions
What is the KPI in the Saas metrics dashboard?
KPI in a SaaS dashboard refers to Key Performance Indicators, which are measurable values used to evaluate the success of a SaaS business. These indicators help track progress toward strategic goals and provide actionable insights for decision-making.What are the limitations of the Saas metrics dashboard?
Limitations of a SaaS metrics dashboard include potential data inaccuracies, limited scope of metrics, and difficulty in capturing qualitative aspects of performance. Additionally, overloading the dashboard with too many metrics can overload information and hinder decision-making.Try FusionChart for Free and Build a Professional SaaS Dashboard in Minutes
Ready to take control and revolutionize your SaaS performance? Save time and resources on complex Saas metrics dashboard solutions. Try FusionCharts for Free today! Build a professional SaaS dashboard in minutes, unlock the power of your data, and drive your business to new heights. Start your free trial now and unlock your business potential!
What is the purpose of metrics dashboard?
Saas metrics dashboard provides a visual representation of key metrics and performance indicators. It helps stakeholders quickly assess the business's health, identify trends, and make data-managed decisions to optimize operations and drive growth.What should you keep in mind while choosing metrics for your Saas dashboard?
When choosing metrics for a SaaS dashboard, relevance to business objectives, data accuracy, and alignment with key performance areas must be considered. Focus on selecting metrics that provide actionable insights, measure progress towards strategic goals, and are easily understandable by stakeholders. Additionally, metrics must be regularly reviewed and updated to remain relevant and effective.