Creating Responsive Dashboards with Interactive Charts and Bootstrap

Wikipedia defines dashboards as easy-to-read, often single page, real-time user interfaces, showing a graphical representation of the current status and the historical trends of an organization’s key performance indicators to enable instantaneous and informed decisions to be made at a glance.
If you are somebody who works with dashboards and information systems regularly, you’d know that at a glance is the keyword here and a pretty crucial one at that—considering the number of devices with different screen resolutions that are available and are increasingly being used for browsing. This mandates adopting responsive web design.
FusionCharts suggests a solution for creating responsive dashboards that is as simple as it gets.
The Problem at Hand
In today’s day and age, browsing web pages is not restricted to just through desktops—smartphones and tablets have caught up. However, if the layout of a website/application is not responsive, browsing on a device smaller than the conventional desktop often needs a lot of re-sizing. Consequently, users find it difficult to navigate through and comprehend the data on the screen.
In case of dashboards, it is important that all the information showcased fits within one screen; the use of a scroll should be as minimal as possible. Earlier designers could create separate web pages that could be rendered on mobile phones. However, with the present range of devices that users can use to access data, designing something that is consistent across resolutions of different kind of devices is a cumbersome task.
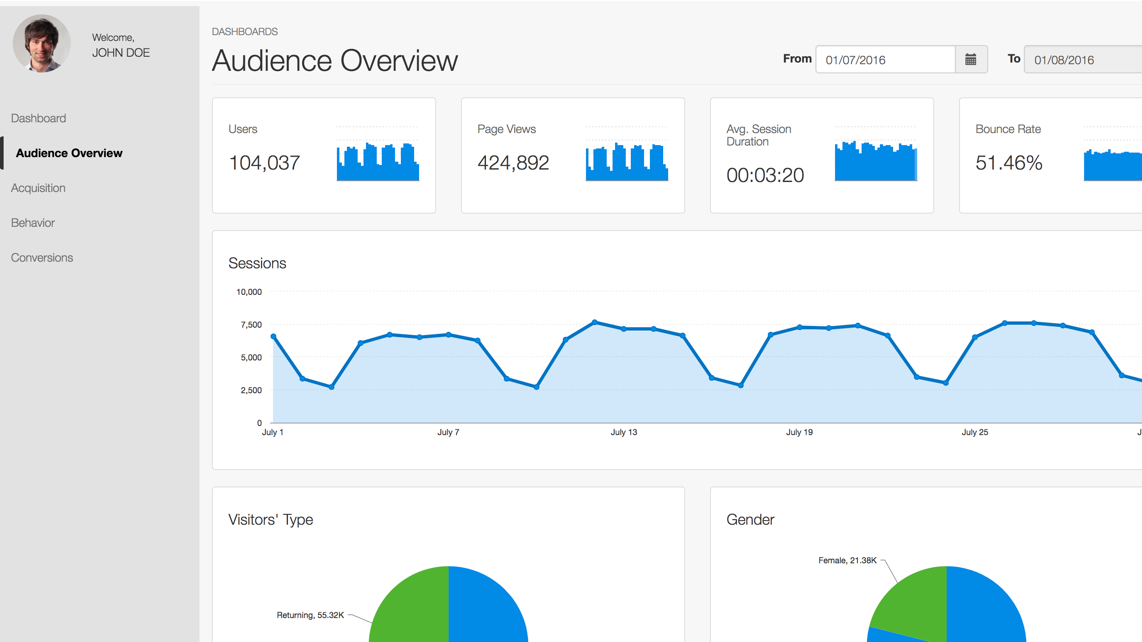
As a result, the viewing experience of a user and the productivity of the organization suffer. The Google Analytics dashboard gives website owners a holistic view of the website traffic statistics. The dashboard gives you traffic information for a specified duration, which includes the total number of visitors for that duration, traffic classification (based on visitor type, gender, age group, traffic source, and location), and so on.
The Google Analytics dashboard is a great example of how dashboards should be and what information they should communicate. However, the dashboard is not responsive, which makes it difficult to be viewed using mobile devices.
The Solution
FusionCharts Suite XT being a front-end, JavaScript-based charting library, is a comprehensive collection of simple and complex charts (like the column and bar charts, pie and doughnut charts, treemap, heatmap, logarithmic charts), gauges and widgets (like the angular gauge, bulb gauge, thermometer gauge, and funnel and pyramid charts), and maps (for all continents, major countries, and all US states). All charts in the suite are responsive and can be extensively used to create dashboards for showcasing data across different functions and domains, including Finance, Sales, Marketing, IT, Healthcare, Education, and Government.
To add to the visualization experience offered by FusionCharts, a responsive web layout is all that is needed. FusionCharts can be easily integrated with Bootstrap, to create responsive dashboards.
Bootstrap is an open source, front-end web framework, used for designing web applications and websites. The framework is built on CSS and written in LESS (a style sheet language that uses variables, functions, and several other techniques to help make your CSS customizable).
Bootstrap comes with a collection of free to download and use templates, simplifying website designing significantly. The templates are showcased along with their source code, so all you need to do is modify the source code to suit your requirements—no coding from scratch required.
Responsiveness to the client device’s screen resolution is Bootstrap’s strongest feature. Merging FusionCharts’ ready-to-use chart samples with Bootstrap’s responsive, ready-to-use templates makes creating dashboards easier than ever.
Since Bootstrap plugins are heavily dependant on jQuery, the FusionCharts jQuery plugin can be used to simplify communication between the two.
The problem with respect to the Google analytics can be solved if we create a dashboard using the FusionCharts jQuery plugin with the Bootstrap library. Using FusionCharts lets you pick the right chart type for showcasing specific kinds of data; using Bootstrap allows you to create a responsive dashboard that is rendered and works consistently across all platforms and browsers.
How we did it?
This article is a step-by-step explanation of how FusionCharts and Bootstrap have been used to create the Google Analytics dashboard.
Pre-requisites To get the code in this article working we need the below packages installed for the project:
- Fusioncharts Suite XT (for rendering charts on the dashboard)
- Jquery-1.12.4.min.js (for Bootstrap’s JavaScript plugins)
- Fusioncharts jquery plugin (for using the jQuery syntax to render and manipulate charts seamlessly across browsers and devices)
- Moment.js (for displaying and manipulating dates in JavaScript; prerequisite for the Bootstrap Datetimepicker library)
- Bootstrap library—including the .css and .js files (for adding responsiveness to the dashboard)
- Bootstrap DateTimePicker library (for handling date and time inputs)
Installing Fusioncharts Suite XT You can easily buy a licensed version of FusionCharts to use in any commercial application or download the trial version that is available for free with no feature restriction (trial version will show an evaluation watermark).
Once you have bought the licensed or downloaded the trial version, installation of FusionCharts Suite XT merely involves copying and pasting the JavaScript files from the download package into your project folder. Thereafter, you can simply include the FusionCharts JavaScript library in your web applications and start building your charts, gauges, and maps.
Setting up FusionCharts Suite XT
- Create a folder named fusioncharts in your working folder.
- Copy the JavaScript files from the js folder of the download package and paste it in your fusioncharts folder.
- Create HTML pages and include the above JavaScript files through a relative path to start creating charts.
Installing jQuery
- Download jquery file from here.
- You can place the jquery-1.12.4.min.js in the js folder of your working directory.
- Include the file in the required page using the command line given below:
<script type=”text/javascript” src=”./js/jquery-1.12.4.min.js” > </script>
Installing the FusionCharts jQuery plugin
- Download the Fusioncharts jquery plugin from here.
- Extract the downloaded zip file and copy the fusioncharts.jqueryplugin.js file from the src folder to the fusioncharts folder in the working directory.
- Installing Moment.js
- Download Moment.js from here.
- Place the file in the js folder of your working directory.
- Include the file in the required page using the command line given below:
<script type=”text/javascript” src=”./js/moment-with-locales.js” > </script>
Installing the Bootstrap library
- Download Bootstrap from here.
- Extract and place all the folders in your working directory.
- Include links to the required assets (the CSS and JS files, and so on) in the HTML page that you create, as shown below:
<link rel="stylesheet" type="text/css" href="./css/bootstrap.min.css">
<link rel="stylesheet" type="text/css" href="./css/bootstrap-theme.min.css">
<script type="text/javascript" src="./js/bootstrap.min.js"></script>
Installing the Bootstrap DateTimePicker library
- Download the DateTimePicker library from here.
- From the downloaded library, copy the bootstrap-datetimepicker.js file to the js folder and the bootstrap-datetimepicker.css file o the css folder of your working directory.
In the required pages, include these files using the command lines given below:
<link rel="stylesheet" type="text/css" href="./css/bootstrap-datetimepicker.css">
<script type="text/javascript" src="./js/bootstrap-datetimepicker.js"></script>
Create a file index.html in the root for the working directory.
- Create a file data.js for holding the data in the js folder of your working directory.
- Create a file dashboards.js for holding the data in the js folder of your working directory.
- Include all the dependencies that you have installed in the index.html page, the file should be in the same order as they are mentioned below:
<body>
</body>
<!-- User defined script -->
<script type="text/javascript" src="./js/data.js"></script>
<script type="text/javascript" src="./js/dashboards.js"></script>
<!-- end -->
</html>
Using Bootstrap for Creating FusionCharts
Step 1: Creating a view using Bootstrap You can create your own view template using the Bootstrap CSS and JS library or you can download a free bootstrap template , like the one used for the Google Analytics dashboard.Free Bootstrap templates can be downloaded from Start Bootstrap’s collection of free templatesor from W3School’s collection of free Bootstrap templates. We’ve used the Analytics template from W3School for our sample dashboard.
The image below shows the layout of the Analytics template with respect to our dashboard:
For demonstration purposes, this tutorial will focus on adding the datetimepicker component and the column 2D chart for showing the number of users for the selected duration.
Step 2: Adding charts to your page
- In the data.js file add the data to be plotted on the chart, as shown below: Now this data is an array of objects that have 2 parts “label” &“values”, where “labels” are the names of the data points that are displayed on the x-axis of a chart and “values” are plot values i.e. values of each data plot (line, column, bar, pie) displayed on the chart.
var user_chart_data = [{ "label": "July 1", "value": "5470" }, { "label": "July 2", "value": "2938" }, { "label": "July 3", "value": "2457" }, { "label": "July 4", "value": "4946" }, { "label": "July 5", "value": "5570" }, { "label": "July 6", "value": "5379" }, { "label": "July 7", "value": "5572" }, { "label": "July 8", "value": "5212" }, { "label": "July 9", "value": "2975" }, { "label": "July 10", "value": "2476" }, { "label": "July 11", "value": "5208" }, { "label": "July 12", "value": "6269" }, { "label": "July 13", "value": "5973" }, { "label": "July 14", "value": "5913" }, { "label": "July 15", "value": "5559" }, { "label": "July 16", "value": "2705" }, { "label": "July 17", "value": "2505" }, { "label": "July 18", "value": "5420" }, { "label": "July 19", "value": "5885" }, { "label": "July 20", "value": "5919" }, { "label": "July 21", "value": "6005" }, { "label": "July 22", "value": "5418" }, { "label": "July 23", "value": "3109" }, { "label": "July 24", "value": "2670" }, { "label": "July 25", "value": "5407" }, { "label": "July 26", "value": "6183" }, { "label": "July 27", "value": "6098" }, { "label": "July 28", "value": "5955" }, { "label": "29", "value": "5572" }, { "label": "30", "value": "3143" }, { "label": "31", "value": "2676" }]; - In the dashboard.js file add the code shown below; as this code will create an instance of the user chart and will render the user chart.
$("#user-chart-container").insertFusionCharts({
type: 'column2d',
width: '100%',
height: '100',
id: 'chart1',
dataFormat: 'json',
dataSource: {
"chart": {
  "paletteColors": "#0075c2",
  "showvalues": "0",
  "divlinealpha": "30",
  "numdivlines": "3",
  "showlabels": "0",
  "showYAxisValues": "0",
  "yAxisMaxValue": "9000",
  "palettecolors": "008ae6",
  "plotspacepercent": "0",
  "chartLeftMargin": "0",
  "chartRightMargin": "0",
  "plotToolText": "
$label,Users: $datavalue
",
  "theme": "zune"
},
"data": user_chart_data //Variable in data.js that contains the json
}
});
Make sure that both files data.js and dashboard.js in the js folder of your working directory and included in the index.html file.
<script type="text/javascript" src="./js/data.js"></script>
<script type="text/javascript" src="./js/dashboard.js" ></script>
Create a container for rendering the charts using the '<div>' tag anywhere in the body tag of the html page wherever you want the user chart to be rendered, as shown below: <div id="user-chart-container"> Fusioncharts will load here
Use the insertFusionCharts() constructor given in point 2 to create a chart instance and render it
Step 3: Adding the Datetimepicker Component
Once the library files are downloaded and included in the page, you can add the datetimepicker using the code snippet shown below inside the body of the html page as the first row of the main page content:
Now this will generate a top bar with a form that has 2 input box one which takes the input as the date and the other disabled input box that will have the date manipulated 1 month forward in the accordance to the 1st input box.
  <div class="row">
<div class="col-sm-4" id="dashboard">
 <span class="small text-uppercase text-muted">Dashboards</span>
 <h1 id="Audience Overview">Audience Overview</h1>
</div>
<div class="col-sm-8">
 <div class="row">
   <div class='col-sm-12 form-inline datetimepickerwrapper'>
     <div class="form-group">
       <label>From</label>
       <div class='input-group date' id='datetimepicker6'>
         <input type='text' class="form-control" value="01/07/2016" data-provide="datepicker"  />
         <span class="input-group-addon">
                       <span class="glyphicon glyphicon-calendar"></span>
         </span>
       </div>
     </div>
     <div class="form-group">
       <label>To</label>
       <div class='input-group date' id='datetimepicker7'>
         <input type='text' class="form-control" value="1/08/2016" disabled="true" />
         <span class="input-group-addon">
                       <span class="glyphicon glyphicon-calendar"></span>
         </span>
       </div>
     </div>
   </div>
 </div>
</div>
</div>
Add these to lines to the dashboard.js file in a onload function , which will initialize the datetimepicker component for the input box .Here we find the current date as max_pickupDate and give the datetimepicker a max limit of the calendar i.e. 1 month ago.
$(function() {
var max_pickup_Date = new Date();
var maxDate = new Date(new Date(max_pickup_Date).setMonth(max_pickup_Date.getMonth()-1));
$('#datetimepicker6').datetimepicker({
   format:'DD/MM/YYYY',
   maxDate : maxDate
 });
$('#datetimepicker7').datetimepicker({
   format:'DD/MM/YYYY'
 });
Step 4: Adding an Event Listener for the Change in Date
In the dashboard.js file, add the code for the onchange event listener, as shown below. This event listener will execute the seed_data() function and calculate the date after one month of the date specified using the <input> tag.
    $("#datetimepicker6").on("dp.change", function(e) {
       $('#datetimepicker6 input').blur();
       $("#loader").removeClass("hidden");

       var pick_up_date = new Date(e.date);
       var one_month_foward = new Date(new Date(pick_up_date).setMonth( pick_up_date.getMonth() + 1));
      $('#datetimepicker7').data("DateTimePicker").date(one_month_foward);
      });
    setTimeout(function(){
 seed_data(pick_up_date,one_month_foward);
       }, 1);
Step 5: Seeding data on change in Date
Every time there is a change in the value attribute of the <input> tag (which takes the input for the start date) the onchange event is triggered. This event calculates the date one month after the specified date and calls the seed_data() function. The seed_data() function takes the following two input parameters: pick_up_date (date specified using the <input> tag one_month_forward
The seed_data() function creates random data that will update the data in the charts on the dashboard using the update_chart() function. The update_chart() function takes the following input parameters: chart: object of the chart to be updated , now this object is the id attribute in the chart. i: chart id number for eg if your chart id is chart5 then your i = 5; obj: dataset of values that will be used to update the chart
The implementation of the update_chart() function for the Google Analytics dashboard is given below:
function update_chart(chart , i , obj)
 {
    //Setting Timeout for the render of charts so that the change in each chart can be noticed .
     setTimeout(function(){
       //Updating Chart with a new set of values
       chart.setJSONData(obj);
     } , 500 + i*300);
 }
function data_export(dataset , day)
{
   if(dataset[day].length > 0)
   {
     return dataset[day].shift();
   }
   else
   {
     for(var i = 0; i < 7; i++) {
         day++;
         if(dataset[day%7].length > 0)
         {
           return dataset[day%7].shift();
         }
     }
   }
}
 //Calculating fake data to be seeded in the graph
 function seed_data(pick_up_date , one_month_foward)
 {
     //Flag variable
     var count =0;
     //Collection to store Data for the chart according to the day
     var dataset = [[],[],[],[],[],[],[]];

     //Collection of all the months
     var monthNames = ["January", "February", "March", "April", "May", "June",
                       "July", "August", "September", "October", "November", "December"
                      ];

     //Calculating all the days between the two choosen dates
     var currentDate = new Date(pick_up_date.getTime());
     //Collection of all the 31 dates between the choosen date and the the after a month
     var  between = [];
     //Loop to find out the next 31 days from the pickup date
     while (currentDate <= one_month_foward || between.length < 31) {
         between.push(new Date(currentDate));
         currentDate.setDate(currentDate.getDate() + 1);
     }
     obj = chart1.getJSONData();
     day = static_date.getDay();
     //Getting current dataset
     $.each( obj['data'], function( k, v ) {
         dataset[day%7].push(v.value);
         day++;
       });
     //Creating fake data
     $.each( obj['data'], function( k, v ) {
       //Random data
         var rndm = data_export(dataset,between[count].getDay());
         v.value = parseInt(rndm) + (Math.floor(Math.random() * rndm/50) + 20);
         v.label = monthNames[between[count].getMonth()] + " " + between[count].getDate() + " " + between[count].getFullYear() ;
         count++;
     });
     //Updating the value of the remaining charts
     update_chart(chart1 , 1 , obj);
     day = between[0].getDay();

 }
});
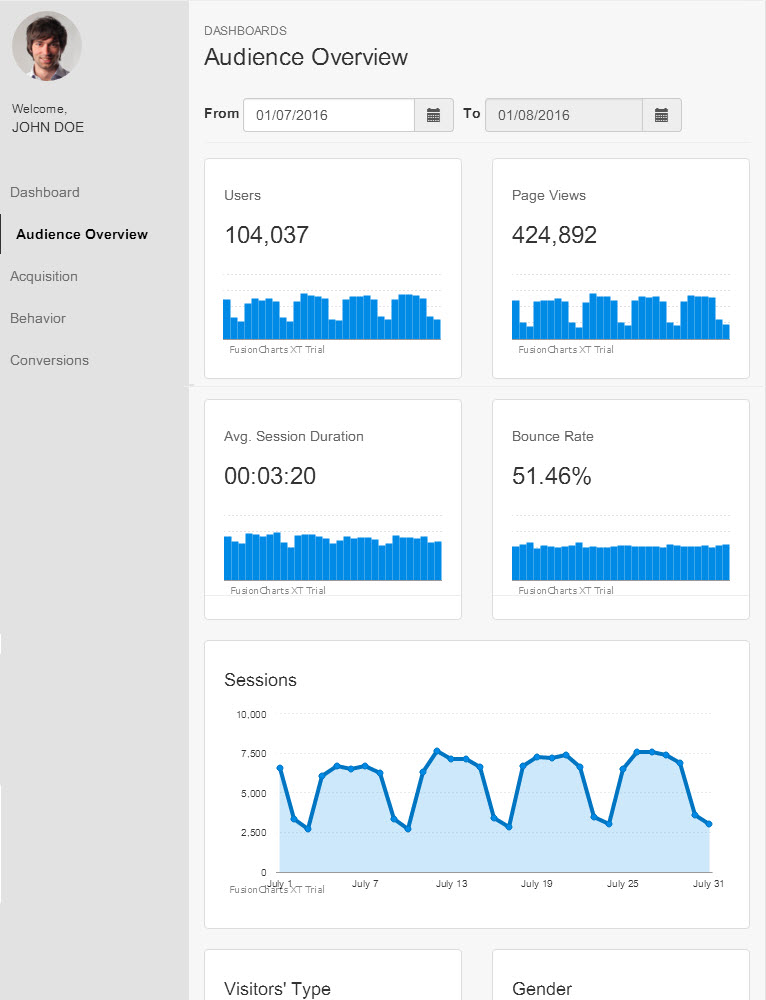
Example: Creating a Responsive Dashboard with Interactive Charts For demonstrating how Bootstrap and FusionCharts can be used together to create impressive, and responsive, dashboards, we’ve reproduced one part of the Google Analytics dashboard and made it responsive, as shown in the image below:
Click here to view the dashboard in action. Try rendering it on devices with different screen resolutions to see how the dashboard layout adapts to the current screen resolution.
The images below are partial screenshots showing how the dashboard layout readjusts to fit in on a phone and an iPad.

You can view some more interactive business dashboards or to know more about dashboards, download our white paper Dashboards—Helping ISVs create a competitive advantage in a data-driven age
 Conceptualizing an effective business dashboard
  The Ten Commandments of Designing an Information Dashboard
  Creating Responsive Dashboards with Interactive Charts and Bootstrap
 Introduction to Collaboration Dashboard
 Cleartrip Tracks Payment Failure in Milliseconds
 Behind the scenes of Server Density’s dashboard design
 Twitter’s New Analytics Dashboard


