Table of Contents
Composer-Setup.exe. Laravel 5: Like most frameworks nowadays, there are a couple of ways to install Laravel. In this example, we’ll do the most straightforward installation using Composer. composer create-project --prefer-dist laravel/laravel5 blog Note: Here, blog is the name of our application folder. FusionCharts Suite XT (Download): Download the FusionCharts Suite XT zip file and store all the extracted script files inside the public/js folder. Include it in the html section of index.blade.php file which is inside the views/fusioncharts section using the following format: <script type="text/javascript" src="{{ asset('js/fusioncharts.js') }}"></script>
<script type="text/javascript" src="{{ asset('js/fusioncharts.charts.js') }}"></script>
<script type="text/javascript" src="{{ asset('js/fusioncharts.theme.fint.js') }}"></script>
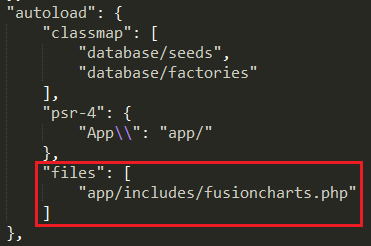
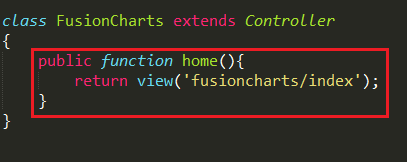
FusionCharts PHP Wrapper (Download): Extract the FusionCharts PHP wrapper and save the fusioncharts.php inside the composer.json file. Add the required files in autoload section – in a new entry called files as shown below: composer dump-autoload for changes to take effect. php artisan make:controller FusionCharts . Route::get('/fusioncharts', 'FusionCharts@home'); view\fusioncharts folder. <?php
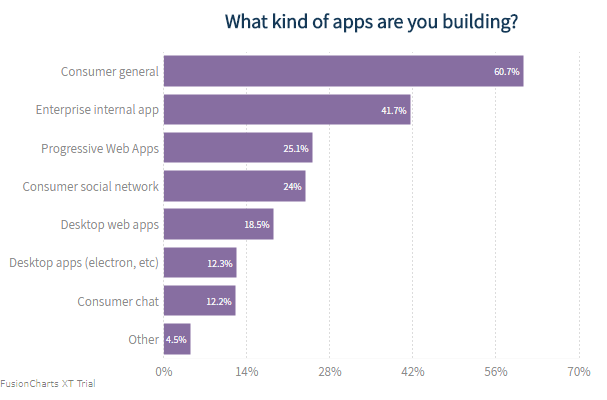
$barChart = new FusionCharts("bar2d", "myFirstChart" , 600, 400, "chart-container", "json",
' {
"chart": {
"caption": "What kind of apps are you building?",
"numberSuffix": "%",
"paletteColors": "#876EA1",
"useplotgradientcolor": "0",
"plotBorderAlpha": "0",
"bgColor": "#FFFFFFF",
"canvasBgColor": "#FFFFFF",
"showValues":"1",
"showCanvasBorder": "0",
"showBorder": "0",
"divLineColor": "#DCDCDC",
"alternateHGridColor": "#DCDCDC",
"labelDisplay": "auto",
"baseFont": "Assistant",
"baseFontColor": "#153957",
"outCnvBaseFont": "Assistant",
"outCnvBaseFontColor": "#8A8A8A",
"baseFontSize": "13",
"outCnvBaseFontSize": "13",
"yAxisMinValue":"40",
"labelFontColor": "#8A8A8A",
" captionFontColor": "#153957",
"captionFontBold": "1",
"captionFontSize": "20",
"subCaptionFontColor": "#153957",
"subCaptionfontSize": "17",
"subCaptionFontBold": "0",
"captionPadding": "20",
"valueFontBold": "0",
"showAxisLines": "1",
"yAxisLineColor": "#DCDCDC",
"xAxisLineColor": "#DCDCDC",
"xAxisLineAlpha": "15",
"yAxisLineAlpha": "15",
"toolTipPadding": "7",
"toolTipBorderColor": "#DCDCDC",
"toolTipBorderThickness": "0",
"toolTipBorderRadius": "2",
"showShadow": "0",
"toolTipBgColor": "#153957",
"theme": "fint"
},
"data": [{
"label": "Consumer general",
"value": "60.7"
}, {
"label": "Enterprise internal app",
"value": "41.7"
}, {
"label": "Progressive Web Apps",
"value": "25.1"
}, {
"label": "Consumer social network",
"value": "24"
}, {
"label": "Desktop web apps",
"value": "18.5"
}, {
"label": "Desktop apps (electron, etc)",
"value": "12.3"
}, {
"label": "Consumer chat",
"value": "12.2"
}, {
"label": "Other",
"value": "4.5"
}]
}');
$barChart->render();
?>
Thereafter, add a div container where the chart will render. <div id="chart-1">Fusion Charts will render here</div> php artisan serve and then route to the path which we have already set up in our route directory for the view of the chart – e.g., https://127.0.0.1:8000/fusioncharts Your output should look like the image shown below: To create pie charts and generate statistical data, you’ll find this list of the best…
To implement FusionCharts in a dynamically resizing flexbox layout, ensure that the chart's dimensions are…
At FusionCharts, we believe in empowering developers and businesses with cutting-edge data visualization tools that…
Ever had a data set that seemed more complicated than a Rubik's cube? You’re not…
We’ve all seen them in textbooks or presentations—those overlapping circles that simplify complex information into…
We’re excited to announce the upcoming release of FusionCharts v4.1—a groundbreaking step forward in the…
View Comments
Hi,
How do you use database data to create graphs?