Laravel is a PHP framework for creating web applications. Laravel is a framework made up of ready-to-use tools, libraries, and assets. It is built on the MVC paradigm, which allows developers to divide applications into a business layer, a model, a rendering layer, a view, an application layer, and a controller.
Laravel, like most frameworks these days, relies heavily on Composer to manage its dependencies. Because Laravel is a mash-up of various libraries, it keeps them tidy. Because it is partially based on Symfony, the file structure and syntax are similar.
5.6.4 is the earliest PHP version required for Laravel to function. Laravel will also work with PHP 7, the most recent version.
In this post, we’ll go over how to create Data Charts on web applications with Laravel, FusionCharts, and a PHP module.
Table of Contents
Part 1: Including Dependencies
To render FusionCharts using Laravel, we need to include the following:
Composer (Download): Download and run Composer-Setup.exe.
Laravel 5: Like most frameworks nowadays, there are a couple of ways to install Laravel. In this example, we’ll do the most straightforward installation using Composer.
composer create-project --prefer-dist laravel/laravel5 blog
Note: Here, blog is the name of our application folder.
FusionCharts Suite XT (Download): Download the FusionCharts Suite XT zip file and store all the extracted script files inside the public/js folder. Include it in the html section of index.blade.php file which is inside the views/fusioncharts section using the following format:
<script type="text/javascript" src="{{ asset('js/fusioncharts.js') }}"></script>
<script type="text/javascript" src="{{ asset('js/fusioncharts.charts.js') }}"></script>
<script type="text/javascript" src="{{ asset('js/fusioncharts.theme.fint.js') }}"></script>
FusionCharts PHP Wrapper (Download): Extract the FusionCharts PHP wrapper and save the fusioncharts.php inside the composer.json file. Add the required files in autoload section – in a new entry called files as shown below:
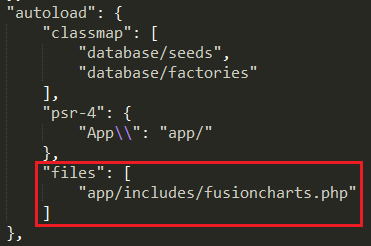
Note: Don’t forget to run composer dump-autoload for changes to take effect.
Part 2: Creating Controller and Its View to Render the Chart
Step 1: Implementing the Controller
Create a FusionCharts controller using the command php artisan make:controller FusionCharts .
Step 2: Routing to Controllers
Define a route for the FusionCharts page, which the FusionCharts Controller will manage since it will only be a static page with no functionality. Now let’s open routes, web.php, inside that add the route as shown below:
Route::get('/fusioncharts', 'FusionCharts@home');
Step 3: Defining Methods
In the previous snippet, home is the name of the method defined within the FusionCharts controller as shown below:
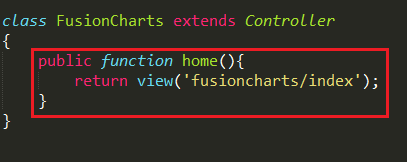
Here, the index is the view page that resides within the view\fusioncharts folder.
Step 4: Creating the View
The view page contains two sections- the html and the php section. In the very 1st step of part-1, we have added the js dependencies into the html section. Here, we will add the php code inside the body as shown below:
<?php
        $barChart = new FusionCharts("bar2d", "myFirstChart" , 600, 400, "chart-container", "json",
            ' {
                "chart": {
                    "caption": "What kind of apps are you building?",
                    "numberSuffix": "%",
                    "paletteColors": "#876EA1",
                    "useplotgradientcolor": "0",
                    "plotBorderAlpha": "0",
                    "bgColor": "#FFFFFFF",
                    "canvasBgColor": "#FFFFFF",
                    "showValues":"1",
                    "showCanvasBorder": "0",
                    "showBorder": "0",
                    "divLineColor": "#DCDCDC",
                    "alternateHGridColor": "#DCDCDC",
                    "labelDisplay": "auto",
                    "baseFont": "Assistant",
                    "baseFontColor": "#153957",
                    "outCnvBaseFont": "Assistant",
                    "outCnvBaseFontColor": "#8A8A8A",
                    "baseFontSize": "13",
                    "outCnvBaseFontSize": "13",
                    "yAxisMinValue":"40",
                    "labelFontColor": "#8A8A8A",
                    " captionFontColor": "#153957",
                    "captionFontBold": "1",
                    "captionFontSize": "20",
                    "subCaptionFontColor": "#153957",
                    "subCaptionfontSize": "17",
                    "subCaptionFontBold": "0",
                    "captionPadding": "20",
                    "valueFontBold": "0",
                    "showAxisLines": "1",
                    "yAxisLineColor": "#DCDCDC",
                    "xAxisLineColor": "#DCDCDC",
                    "xAxisLineAlpha": "15",
                    "yAxisLineAlpha": "15",
                    "toolTipPadding": "7",
                    "toolTipBorderColor": "#DCDCDC",
                    "toolTipBorderThickness": "0",
                    "toolTipBorderRadius": "2",
                    "showShadow": "0",
                    "toolTipBgColor": "#153957",
                    "theme": "fint"
                  },

                "data": [{
                    "label": "Consumer general",
                    "value": "60.7"
                  }, {
                    "label": "Enterprise internal app",
                    "value": "41.7"
                  }, {
                    "label": "Progressive Web Apps",
                    "value": "25.1"
                  }, {
                    "label": "Consumer social network",
                    "value": "24"
                  }, {
                    "label": "Desktop web apps",
                    "value": "18.5"
                  }, {
                    "label": "Desktop apps (electron, etc)",
                    "value": "12.3"
                  }, {
                    "label": "Consumer chat",
                    "value": "12.2"
                  }, {
                    "label": "Other",
                    "value": "4.5"
                }]
            }');
        $barChart->render();
    ?>
Thereafter, add a div container where the chart will render.
<div id="chart-1">Fusion Charts will render here</div>
Step 5: Executing the Code
Finally, run the server by the command php artisan serve and then route to the path which we have already set up in our route directory for the view of the chart –
e.g., https://127.0.0.1:8000/fusioncharts
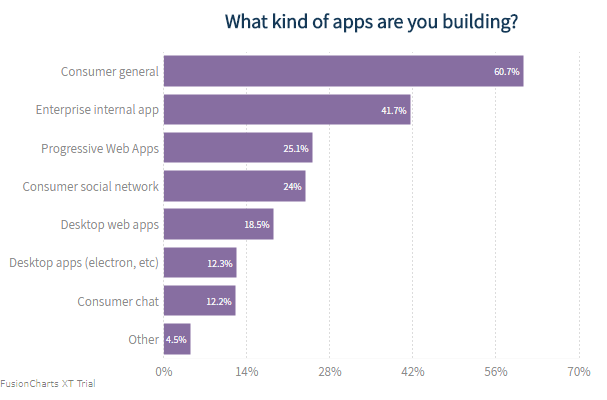
Your output should look like the image shown below:
If you see any errors in your code, click here to download the complete source code of the sample project we have created for this tutorial.