Table of Contents
npm install -g bowerTestPolymerbower initbower.json file in the project working directory. bower install --save Polymer/polymer This will install the Polymer JS in the bower_components folder within the TestPolymer project directory. Once you are done with the installation of Polymer JS, cross-check whether it has been perfectly installed: polymer help TestPolymer directory using the command stated below: `bower install fusioncharts<script src="bower_components/webcomponentsjs/webcomponents-loader.js"></script>
<link rel="import" href="bower_components/polymer/polymer.html"></script>
<link rel="import" href="element/polymer-fusioncharts.html">
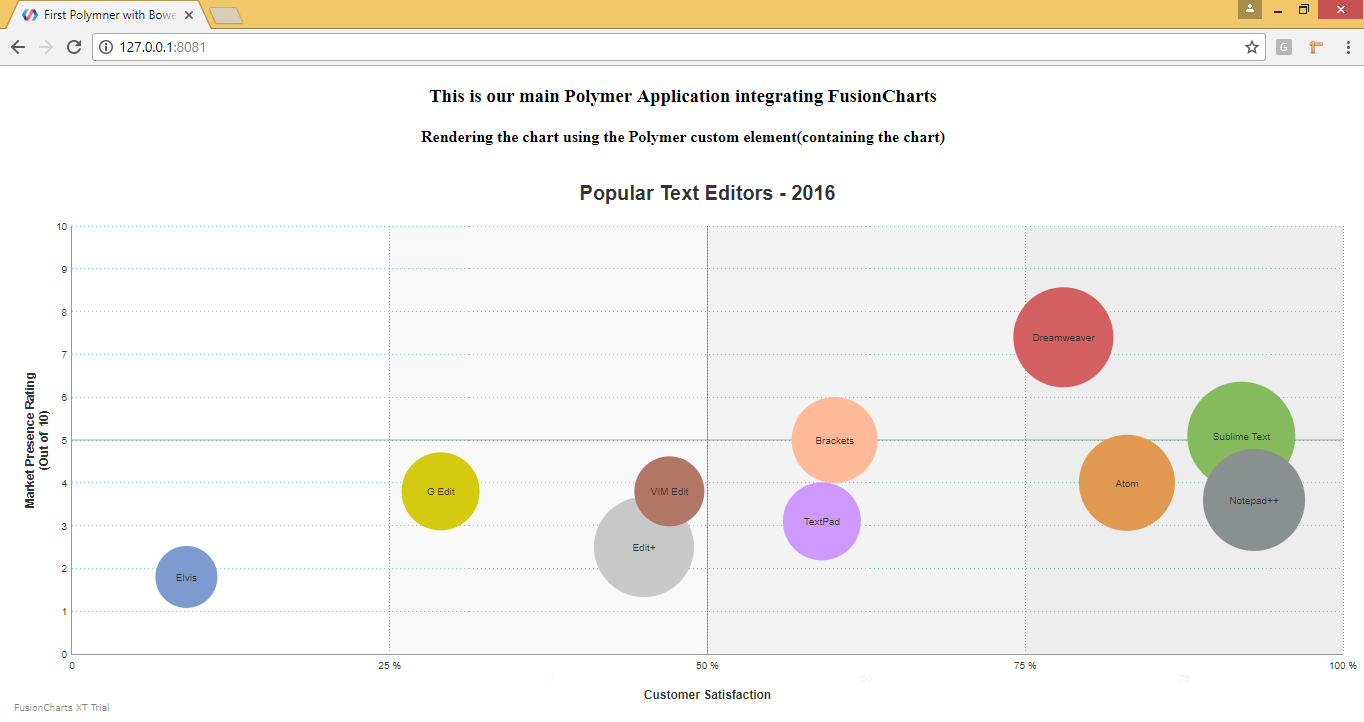
<h3 align="center">This is our main Polymer Application integrating FusionCharts</h3>
<polymer-fusioncharts></polymer-fusioncharts>
<link rel="import" href="../bower_components/polymer/polymer-element.html">
<script src="/bower_components/fusioncharts/fusioncharts.js"></script>
  <script src="/bower_components/fusioncharts/fusioncharts.charts.js"></script>
  <script src="/bower_components/fusioncharts/themes/fusioncharts.theme.fint.js"></script>
<script>
// Your new element extends the Polymer.Element base class
class ChartElement extends Polymer.Element {
static get is() { return 'polymer-fusioncharts'; }
constructor() {
super();
this.textContent = "Rendering the chart using the Polymer custom element(containing the chart)";
this.style = "align: center";
var iDiv = document.createElement('div');
iDiv.id = 'chart-container';
document.getElementsByTagName('body')[0].appendChild(iDiv);
FusionCharts.ready(function () {
var conversionChart = new FusionCharts({
type: 'bubble',
renderAt: 'chart-container',
width: '100%',
height: '550',
dataFormat: 'json',
dataSource: {
"chart": {
"theme": "fint",
"caption": "Popular Text Editors - 2016",
"captionFontSize": "20",
"captionPadding": "20",
"xAxisMinValue": "0",
"xAxisMaxValue": "100",
"yAxisMinValue": "0",
"yAxisMaxValue": "10",
"xAxisName": "Customer Satisfaction",
"yAxisName": "Market Presence Rating{br}(Out of 10)",
"xAxisNameFontSize": "12",
"yAxisNameFontSize": "12",
"numDivlines": "9",
"bubbleScale": "1",
"showValues": "1",
"divLineColor": "#72D7B2",
"plotFillHoverColor": "#98e6e6",
"plotTooltext": "$name{br}Overall Rating - $zvalue",
//Drawing quadrants on chart
"drawQuadrant" : "1",
"quadrantLineAlpha" : "50",
"quadrantLineThickness" : "1"
},
"categories": [
{
"category": [
{
"label": "0",
"x": "0"
},
{
"label": "25 %",
"x": "25",
"showverticalline": "1"
},
{
"label": "50 %",
"x": "50",
"showverticalline": "1"
},
{
"label": "75 %",
"x": "75",
"showverticalline": "1"
},
{
"label": "100 %",
"x": "100",
"showverticalline": "1"
}
]
}
],
"dataset": [
{
"color":"#00aee4",
"data": [
{
"x": "78",
"y": "7.4",
"z": "8",
"name": "Dreamweaver",
"color": "#d35f61"
},
{
"x": "92",
"y": "5.1",
"z": "9.2",
"name": "Sublime Text",
"color": "#86bb5d"
},
{
"x": "60",
"y": "5",
"z": "6",
"name": "Brackets",
"color": "#ffbb99"
},
{
"x": "59",
"y": "3.1",
"z": "5",
"name": "TextPad",
"color": "#ce99ff"
},
{
"x": "9",
"y": "1.8",
"z": "3",
"name": "Elvis",
"color": "#7d9bcf"
},
{
"x": "83",
"y": "4",
"z": "7.4",
"name": "Atom",
"color": "#e19951"
},
{
"x": "93",
"y": "3.6",
"z": "8.3",
"name": "Notepad++",
"color": "#8a8f8f"
},
{
"x": "29",
"y": "3.8",
"z": "5",
"name": "G Edit",
"color": "#d4cb11"
},
{
"x": "45",
"y": "2.5",
"z": "8",
"name": "Edit+",
"color": "#c8c8c8"
},
{
"x": "47",
"y": "3.8",
"z": "4",
"name": "VIM Edit",
"color": "#b27666"
}
]
}
],
"vTrendLines": [
{
"line": [
{
"startValue": "50",
"endValue": "75",
"isTrendZone": "1",
"color": "#aaaaaa",
"alpha": "14"
},
{
"startValue": "75",
"endValue": "100",
"isTrendZone": "1",
"color": "#aaaaaa",
"alpha": "21"
},
{
"startValue": "25",
"endValue": "50",
"isTrendZone": "1",
"color": "#aaaaaa",
"alpha": "7"
}
]
}
]
}
}).render();
});
}
}
//Now, register your new custom element so the browser can use it
customElements.define(ChartElement.is, ChartElement);
</script>
<template>
    <style>
    </style>
    <h4 align="center">Rendering the chart using the Polymer custom element(containing the chart)</h4>
  </template>
With this, the polymer-fusioncharts.html custom element is ready to be used in index.html. Therefore, you can import and add <polymer-fusioncharts></polymer-fusioncharts> which we have already discussed while creating the index.html file. polymer serve The above command will start the server. To get the output on the screen, hit the URL displayed in the Cmder. Check out the final output after hitting the URL (https://127.0.0.1:8081): To create pie charts and generate statistical data, you’ll find this list of the best…
To implement FusionCharts in a dynamically resizing flexbox layout, ensure that the chart's dimensions are…
At FusionCharts, we believe in empowering developers and businesses with cutting-edge data visualization tools that…
Ever had a data set that seemed more complicated than a Rubik's cube? You’re not…
We’ve all seen them in textbooks or presentations—those overlapping circles that simplify complex information into…
We’re excited to announce the upcoming release of FusionCharts v4.1—a groundbreaking step forward in the…