Polymer is a JavaScript library that assists in the development of custom components for a web page or web application. Web components are primitives at the lowest level. Because Polymer is built with web components, these components assist you in defining your own HTML elements. They also give you more flexibility by allowing you to define custom components. The defined custom components are also used in web pages in the same way that any other HTML component is, by using custom tags.
In this post, you’ll learn about Polymer JS’s key features, how to create stunning Live Charts with Fusioncharts in Polymer Applications, and how to troubleshoot.
Table of Contents
Key Features of Polymer JS
Polymer focuses on allowing you to create rich, powerful, reusable web components by defining custom elements. These could be used in web applications built using frameworks like Angular or Ember.
Custom elements can be created using the dom-module element provided by Polymer. Custom element definition comprises of:
- CSS style
- HTML template of the element’s local DOM
- Element properties
- Lifecycle callbacks
- JavaScript methods
Some key features of Polymer JS include:
Constructor
Registering an element associates a class with a custom element name. The class has a constructor that instantiates the associated custom element. Alternatively, document.createElement() can also be used to create and instantiate the element.
Populated with Internal DOM Within Each Instance
Shadow DOM provides a local, encapsulated DOM tree for your element. The Polymer can automatically create and populate a shadow tree for your element from a DOM template.
Styled with Internal Defaults or Externally
The <style></style> tags can be used as usual in the shadow Dom template of the custom elements.
FusionCharts, being a JavaScript-based charting solution can be rendered in Polymer applications. We will define a custom element and register it to a class. The local DOM template of the custom element is holding the FusionCharts chart instance. The custom element will be used in another web page or DOM to render the chart. This custom element is reusable for multiple instances.
Prerequisites
Before you integrate FusionCharts with a Polymer JS application, you need to have a basic understanding of HTML, CSS, JavaScript, and Document Object Model (DOM).
Set the Environment
Before getting into the steps to render the FusionCharts Polymer JS application, let’s first set the environment in our local machine. Some of the basic requirements include:
Step 1
- Install NodeJS (if not installed)
- Install Bower using NPM command as shown below:
npm install -g bower
Step 2
- Create a project directory named
TestPolymer - Step into the project directory created.
- Now, in the TestPolymer working directory, go ahead and initialize bower using the command as shown below:
bower init
This will create a bower.json file in the project working directory.
Step 3
Install Polymer using Bower in the project working directory. Execute the command as shown below:
bower install --save Polymer/polymer
This will install the Polymer JS in the bower_components folder within the TestPolymer project directory.
Once you are done with the installation of Polymer JS, cross-check whether it has been perfectly installed:
polymer help
Step 4
- Install FusionCharts bower component in
TestPolymerdirectory using the command stated below:
`bower install fusioncharts - This will create a bower_components folder in the TestPolymer project folder where you can insert all the FusionCharts downloaded files.
We are all set with the environment and ready to render FusionCharts in the Polymer JS application.
Polymer Custom-Element Within a Polymer JS Application
Step 1
Create an index.html file in the TestPolymer directory. Once done follow the steps mentioned below :
-
- Add the webcomponents-loader.js from the webcomponentsjs folder in the bower_components. The .js file is added as it is a client-side loader and it dynamically loads the minimum polyfill bundle using feature detection. Refer to the script tag added below:
<script src="bower_components/webcomponentsjs/webcomponents-loader.js"></script>
- Add the webcomponents-loader.js from the webcomponentsjs folder in the bower_components. The .js file is added as it is a client-side loader and it dynamically loads the minimum polyfill bundle using feature detection. Refer to the script tag added below:
- Add the following link to index.html.
- This refers to the polymer.html file which is needed to develop the Polymer application.
<link rel="import" href="bower_components/polymer/polymer.html"></script>
- Along with the above file, add the Polymer custom-element (which we will create in Step 2 mentioned below) under <body> of index.html.
<link rel="import" href="element/polymer-fusioncharts.html"> - Now, add the code given below under <body> of the index.html file.
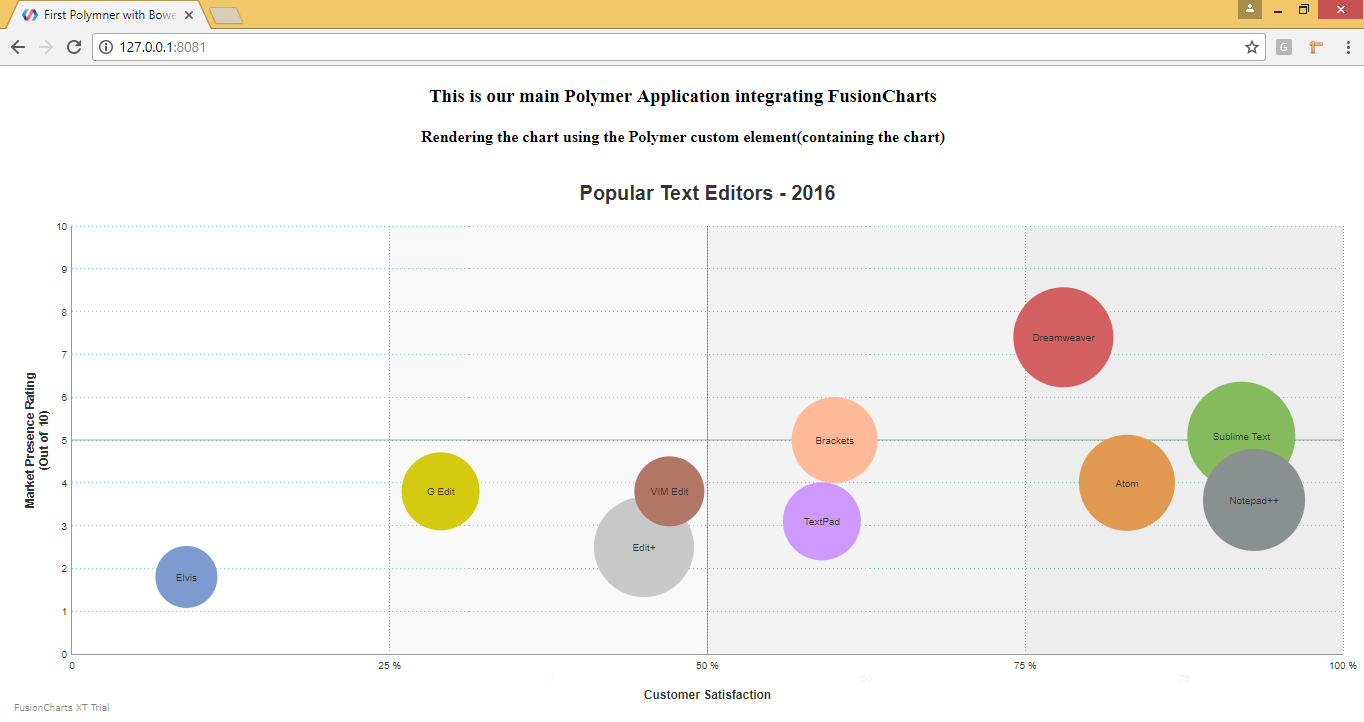
<h3 align="center">This is our main Polymer Application integrating FusionCharts</h3>
<polymer-fusioncharts></polymer-fusioncharts>
Once we are done with the four steps mentioned above, our index.html file is ready with its code implementation.
Step 2
We are all set with our index.html file. Also, we have already mentioned the source code and the page content using the polymer-fusioncharts custom element. Now, let’s create the custom element we added previously:
- Create a new folder in the TestPolymer project directory and name the folder as an element.
- Under the element folder, create a new file named polymer-fusioncharts.html.
- Add polymer-element.html from the polymer folder of bower_components in the polymer-fusioncharts.html file as shown below:
<link rel="import" href="../bower_components/polymer/polymer-element.html"> - To render charts, add FusionCharts library files. Since the created custom element will have the whole chart content in it, the JS files must be included here using the script tag as shown below:
<script src="/bower_components/fusioncharts/fusioncharts.js"></script> <script src="/bower_components/fusioncharts/fusioncharts.charts.js"></script> <script src="/bower_components/fusioncharts/themes/fusioncharts.theme.fint.js"></script> - Once you are done with the inclusion of library files, keep the code that will define a custom element class that extends the Polymer.Element. This is where the chart will be defined using the code mentioned below: Once you are done with the inclusion of library files, keep the code that will define a custom element class that extends the Polymer.Element. This is where the chart will be defined using the code mentioned below:
<script> // Your new element extends the Polymer.Element base class class ChartElement extends Polymer.Element { static get is() { return 'polymer-fusioncharts'; } constructor() { super(); this.textContent = "Rendering the chart using the Polymer custom element(containing the chart)"; this.style = "align: center"; var iDiv = document.createElement('div'); iDiv.id = 'chart-container'; document.getElementsByTagName('body')[0].appendChild(iDiv); FusionCharts.ready(function () { var conversionChart = new FusionCharts({ type: 'bubble', renderAt: 'chart-container', width: '100%', height: '550', dataFormat: 'json', dataSource: { "chart": { "theme": "fint", "caption": "Popular Text Editors - 2016", "captionFontSize": "20", "captionPadding": "20", "xAxisMinValue": "0", "xAxisMaxValue": "100", "yAxisMinValue": "0", "yAxisMaxValue": "10", "xAxisName": "Customer Satisfaction", "yAxisName": "Market Presence Rating{br}(Out of 10)", "xAxisNameFontSize": "12", "yAxisNameFontSize": "12", "numDivlines": "9", "bubbleScale": "1", "showValues": "1", "divLineColor": "#72D7B2", "plotFillHoverColor": "#98e6e6", "plotTooltext": "$name{br}Overall Rating - $zvalue", //Drawing quadrants on chart "drawQuadrant" : "1", "quadrantLineAlpha" : "50", "quadrantLineThickness" : "1" }, "categories": [ { "category": [ { "label": "0", "x": "0" }, { "label": "25 %", "x": "25", "showverticalline": "1" }, { "label": "50 %", "x": "50", "showverticalline": "1" }, { "label": "75 %", "x": "75", "showverticalline": "1" }, { "label": "100 %", "x": "100", "showverticalline": "1" } ] } ], "dataset": [ { "color":"#00aee4", "data": [ { "x": "78", "y": "7.4", "z": "8", "name": "Dreamweaver", "color": "#d35f61" }, { "x": "92", "y": "5.1", "z": "9.2", "name": "Sublime Text", "color": "#86bb5d" }, { "x": "60", "y": "5", "z": "6", "name": "Brackets", "color": "#ffbb99" }, { "x": "59", "y": "3.1", "z": "5", "name": "TextPad", "color": "#ce99ff" }, { "x": "9", "y": "1.8", "z": "3", "name": "Elvis", "color": "#7d9bcf" }, { "x": "83", "y": "4", "z": "7.4", "name": "Atom", "color": "#e19951" }, { "x": "93", "y": "3.6", "z": "8.3", "name": "Notepad++", "color": "#8a8f8f" }, { "x": "29", "y": "3.8", "z": "5", "name": "G Edit", "color": "#d4cb11" }, { "x": "45", "y": "2.5", "z": "8", "name": "Edit+", "color": "#c8c8c8" }, { "x": "47", "y": "3.8", "z": "4", "name": "VIM Edit", "color": "#b27666" } ] } ], "vTrendLines": [ { "line": [ { "startValue": "50", "endValue": "75", "isTrendZone": "1", "color": "#aaaaaa", "alpha": "14" }, { "startValue": "75", "endValue": "100", "isTrendZone": "1", "color": "#aaaaaa", "alpha": "21" }, { "startValue": "25", "endValue": "50", "isTrendZone": "1", "color": "#aaaaaa", "alpha": "7" } ] } ] } }).render(); }); } } //Now, register your new custom element so the browser can use it customElements.define(ChartElement.is, ChartElement); </script>
An optional <template> tag can also be added to the custom element if you want to provide any additional content to the file.
<template>
    <style>
    </style>
    <h4 align="center">Rendering the chart using the Polymer custom element(containing the chart)</h4>
  </template>
With this, the polymer-fusioncharts.html custom element is ready to be used in index.html. Therefore, you can import and add <polymer-fusioncharts></polymer-fusioncharts> which we have already discussed while creating the index.html file.
Step 3
The project is ready but to run the application. However, you have to start the Polymer server using the following command in the terminal:
polymer serve
The above command will start the server. To get the output on the screen, hit the URL displayed in the Cmder.
Check out the final output after hitting the URL (https://127.0.0.1:8081):
If you find any difficulty in rendering the chart or you see any error in your code, click here. You will be able to download the complete source code of the sample project we created for this tutorial.
Troubleshooting
If you can’t see the chart, check that:
- The chart ID is unique for all charts rendered on the same page or it will result in a JavaScript error.
- The fusioncharts.js and other related library files are properly included (especially if the chart does not show up at all).
- The path to files is correct and the files reside there.
- The chart alias names are mentioned correctly.