Table of Contents
fusioncharts.js and fusioncharts.charts.js) in the HTML file, refer to the code below: <html>
<head>
<!-- including FusionCharts core package JS files -->
<script src="path/to/fusioncharts.js"></script>
<script src="path/to/fusioncharts.charts.js"></script>
</head>
</html> Including FusionCharts PHP Wrapper Refer to the code below to include FusionCharts PHP wrapper (fusioncharts.php) in your PHP code. <?php
// including FusionCharts PHP wrapper
include("path/to/fusioncharts.php");
?> Once done, you are all set with the environment in your system to work with Cassandra database. $cluster = Cassandra::cluster()->build();
$keyspace = 'marathons';
// creating session with cassandra scope by keyspace
$session = $cluster->connect($keyspace);
// verifying connection with database
if(!$session) { echo "Error - Unable to connect to database"; }
In the above code: Cassandra::cluster()->build(); will by default establish connection with localhost cluster. You can also specify remote URL to establish connection with remote cluster. withContactPoints() and withPort() methods are used to specify IP addresses or hostnames, and port number of the nodes in a given Cassandra cluster. Refer to this link for more details.$keyspace holds name of keyspace (database) from which data will be fetched for the chart.$session variable is used to establish the connection with the database. In case of any connection error, the above code will throw an error message. You can also create a separate .php file for this step and include it instead of writing it every time.Note: To use Cassandra in PHP, please make sure you have enabled the necessary extensions by including extension=php_cassandra.dll in your php.ini configuration file.$statement = new Cassandra\SimpleStatement( 'SELECT id, name, entry_cost, permile_cost, finisher_count FROM topten' ); // query execution - fully asynchronous $exec = $session->executeAsync($statement); // getting query result in a variable $result = $exec->get();Here,
$result variable holds the data, once the above code is executed. FusionCharts understands both XML and JSON data formats. Since we will be using JSON, we will now append the data (located in $result variable) along with FusionCharts chart configurations and parse the end result as an associative JSON array. Refer to the code below to append data: if($result) {
// creating an associative array to store the chart attributes
$arrData = array(
"chart" => array(
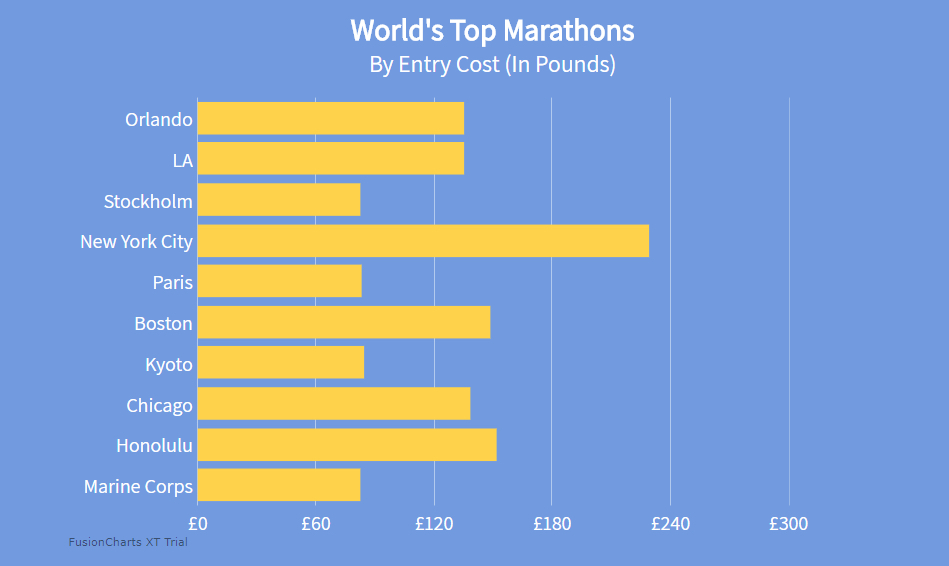
"caption"=> "World's Top Marathons",
"captionFontBold"=> "1",
"captionFontSize"=> "24",
"captionFont"=> "Assistant",
"subcaption"=> "By Entry Cost (In Pounds)",
"subCaptionFontBold"=> "0",
"subCaptionFontSize"=> "19",
"subCaptionFont"=> "Assistant",
"captionPadding"=> "20",
"numberPrefix"=> "£",
"canvasBgColor"=> "#729BDF",
"bgColor"=> "#729BDF",
"canvasBgAlpha"=> "0",
"bgAlpha"=> "100",
"showBorder"=> "0",
"showCanvasBorder"=> "0",
"showPlotBorder"=> "0",
"paletteColors"=> "#FED34B",
"showValues"=> "0",
"decimals"=> "2",
"usePlotGradientColor"=> "0",
"baseFontColor"=> "#FFFFFF",
"baseFont"=> "Assistant",
"baseFontSize"=> "16",
"showAlternateVGridColor"=> "0",
"divLineColor"=> "#DBEAF8",
"divLineThickness"=> "0.9",
"divLineAlpha"=> "60",
"toolTipPadding"=> "7",
"toolTipBgColor"=> "#000000",
"toolTipBorderAlpha"=> "0",
"toolTipBorderRadius"=> "3"
));
$arrData["data"] = array();
// iterating over each data and pushing it into $arrData array
foreach ($result as $row) {
array_push($arrData["data"], array(
"label" => $row["name"],
"value" => $row["entry_cost"]->value(),
"toolText" => "<b>" . $row["name"] . "</b><hr>Entry Cost: £" . number_format((float)$row["entry_cost"]->value(), 2, '.', '') . "<br> Per-mile Cost: £" .number_format((float)$row["permile_cost"]->value(), 2, '.', '') . "<br>Finishers: " . $row["finisher_count"]->value()
));
}
$jsonEncodedData = json_encode($arrData);
In above code, an if statement is used to check whether the value of $result variable is valid or not which creates an associative JSON array to form data for the chart. The chart object under $arrData variable contains chart configuration options for caption, sub-caption, div lines, values, tooltips, color, etc. To know more about customizing the chart cosmetics, you can refer to this developer documentation page. <body> <div id="chart-container"></div> </body>
// creating FusionCharts instance
$toptenChart = new FusionCharts("bar2d", "topChart" , '600', '450', "chart-container", "json", $jsonEncodedData);
// FusionCharts render method
$toptenChart->render();
To create pie charts and generate statistical data, you’ll find this list of the best…
To implement FusionCharts in a dynamically resizing flexbox layout, ensure that the chart's dimensions are…
At FusionCharts, we believe in empowering developers and businesses with cutting-edge data visualization tools that…
Ever had a data set that seemed more complicated than a Rubik's cube? You’re not…
We’ve all seen them in textbooks or presentations—those overlapping circles that simplify complex information into…
We’re excited to announce the upcoming release of FusionCharts v4.1—a groundbreaking step forward in the…