In the 5th and final part of the FusionCharts XT in PHP series, we will learn how to debug our charts. Debugging helps us know what happens behind the scenes while rendering a chart. With the FusionCharts JavaScript Debug Mode, we can generate a complete log of the internal events, as well as any errors that crop up. Since the JavaScript charts are rendered only by the browser, the debug logs will be available in the browser’s Console Log. Let us begin debugging!
Table of Contents
FusionCharts XT in PHP Series
We will understand the debugging process in three sections:
To aid you in basic debugging, the charts show certain messages when something goes wrong. These messages will show up in place of the chart:
or tags.Invalid XML Data message, it means that the XML data document is malformed. Check it for common errors like: and not or ' (XML Attribute Character) and " (HTML Parameter Character). e.g., if you’re using direct HTML embedding method, and using " for HTML parameters, then you need to make sure that all your XML attributes use ' as containers.'FusionCharts JavaScript Debugger provides a very developer-friendly way of debugging the charts.
It enables you to log all the events that take place in the lifetime of a chart. All you need to write is:
// < ![CDATA[ //
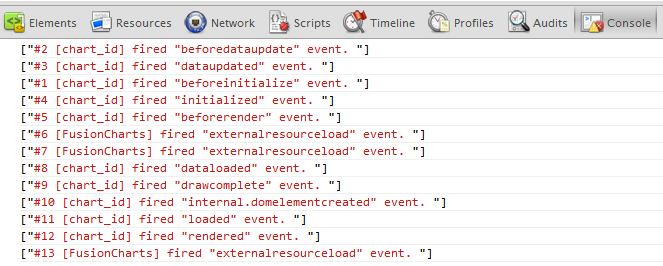
However, with the above line alone you will not be able to see any logs. To see the output, log it to the browser’s console by adding the following line:
FusionCharts.debugMode.outputTo( function() { console.log(arguments); } );
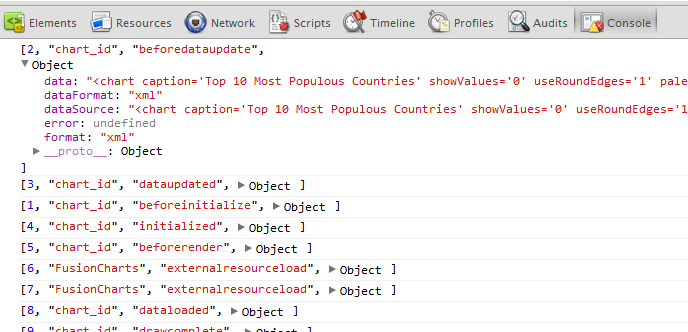
You should see the following events being logged in the browser’s console:
If you are using Firebug, or Chrome’s Developer Tools, you can explore the object hierarchy by setting the output format to verbose:
FusionCharts.debugMode.outputFormat('verbose');
Being good (read lazy) developers ourselves, we write the above 3 lines in a more compact fashion:
FusionCharts.debugMode.enabled( function() { console.log(arguments); }, 'verbose');
And for the rare bug-hunting session when you don’t have Firebug installed, you can include Firebug-Lite remotely:
FusionCharts.debugMode._enableFirebugLite();
The FusionCharts XT JavaScript Class fires events at every stage during the lifetime of a chart. You can listen for the events that fire upon errors in the chart. You can either listen to these events globally, or on a per-chart basis as shown below:
function myChartListener(eventObject, argumentsObject) {
alert( eventObject.sender.id + " has an error: " + argumentsObject.message );
}
FusionCharts("chart_id").addEventListener ("Error" , myChartListener );
The first argument is eventObject which provides details of the event. It is an object which mainly provides three properties :
eventId : An unique ID given to the event
eventType : A string containing the name or the event type, for example, “rendered” etc.
sender : A FusionCharts JavaScript Object reference to the chart which has raised that event
The second argument is argumentsObject is an object and contains details of the event. As per the type of the event the properties of parameter objects varies.
You can read more about Listening to Events in the FusionCharts XT Documentation.
We’ve covered a lot of ground in this series. You can go back and read through the previous articles if you haven’t yet:
Let us know in the comments how you liked this series. We’re putting out more interesting content for all you developers. Stay tuned..
A well-designed dashboard helps users understand complex data quickly, monitor key performance indicators, and make…
Quick Answer: The best commercial chart libraries for Nuxt include FusionCharts, Highcharts, AnyChart, amCharts, ApexCharts,…
Quick Answer To integrate interactive Vue charts into a Vue 3 application, first create a…
If you're looking for the best Vue chart library for interactive data visualization, there isn't…
Modern web applications generate and display more data than ever. They create from business dashboards…
Businesses collect data from multiple sources every day, including sales platforms, marketing tools, customer support…