We are exhibiting at Web 2.0 Expo SF on the 29th & 30th of March, our first time ever in the US, and are very excited about it. We will be showcasing the latest avatar of FusionCharts and FusionCharts for SharePoint (currently in beta) at the expo. As we gear up for the event, I thought I will take you along and give you a sneak peek into our preparation, talk about what to expect from us there and take your opinion on how to make the trip more fun.
Putting together the show
When we decided to exhibit at the expo, we realized it will be a lot of hard work, right from setting the event strategy to figuring out minute details like the font size for the back of the booth. To that list are added additional logistics like travel, visas and shipping since we are based out of India. As I have done with
all the four events that we have exhibited at in the past, I put together a monster todo list with the task name, details, people responsible for it, deadlines and status so that I don’t miss out anything. Here’s what it looks like:
This
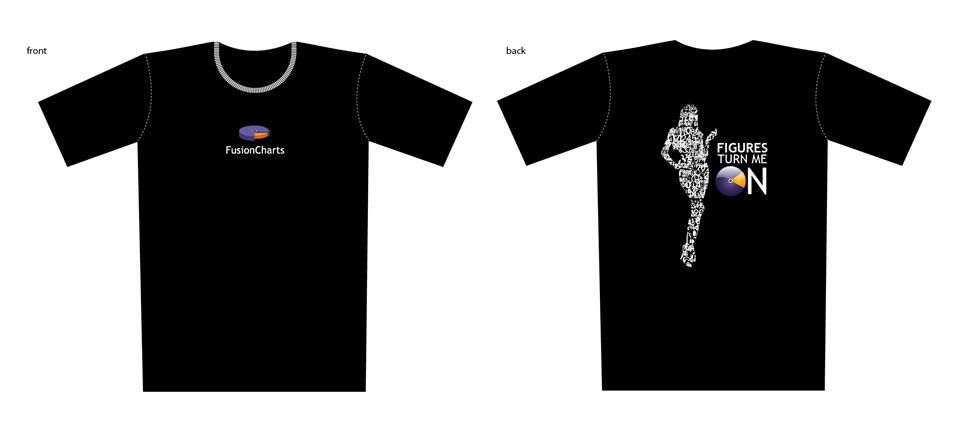
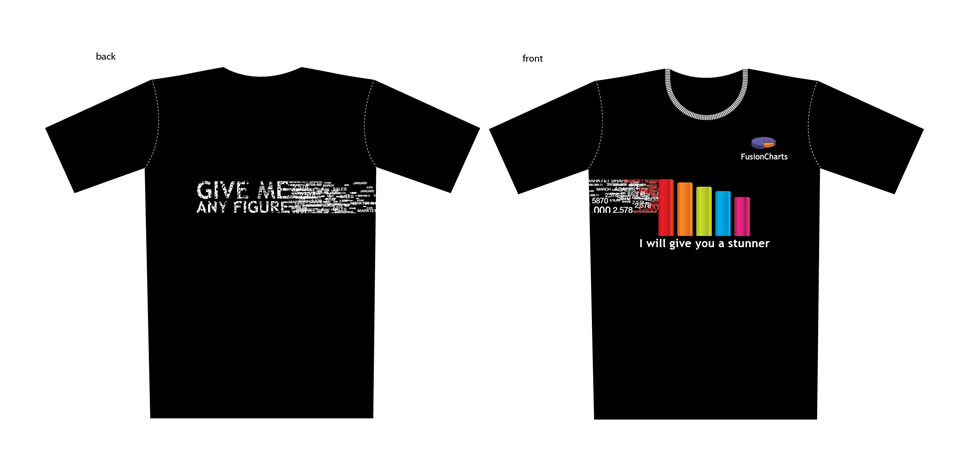
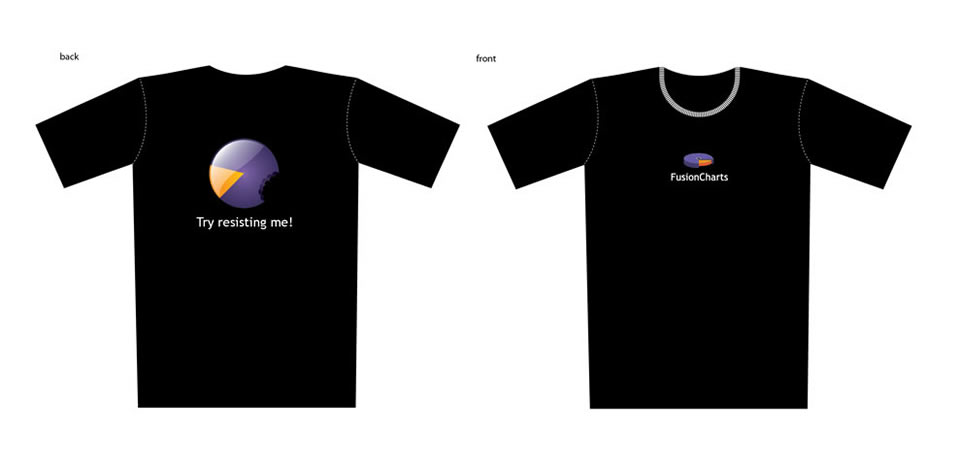
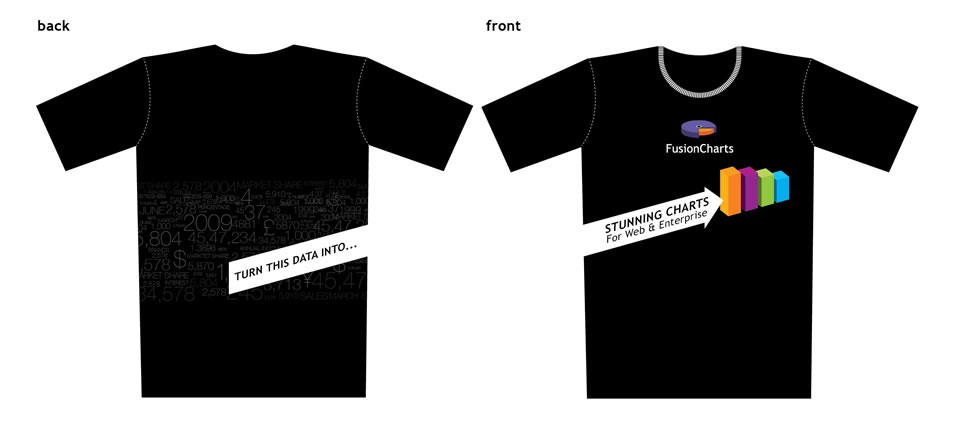
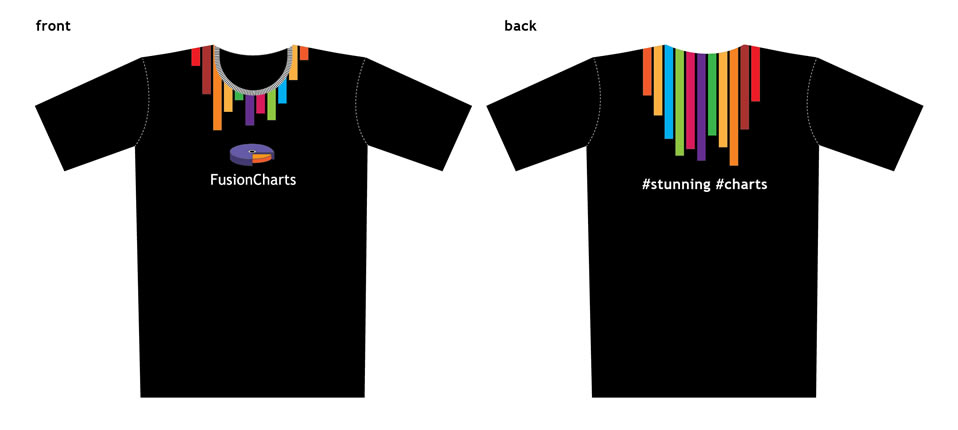
Google Docs spreadsheet is my central point of co-ordination for everything Web 2.0 and I will be regularly updating it as we make progress, which you can keep a track of. If you are a company like ours (small-ish with 50 or lesser people) and are going to be exhibiting for the first time, it should give you a good idea of all the work an expo requires. Not to mention brace you for things to come 🙂 Out of all the tasks that we have completed right now, we had awesome fun getting the new t-shirts designed. We decided to get ourselves something vibrant and fun, something
FusionCharts-ish and
Web 2.0 Expo-ish at the same time. Here are all the options we had in hand:
Which one do you think makes the cut? As of now, we have selected the last two designs, but if we get overwhelming opinion for one of the other designs, we might just go for it 🙂
What to expect from us at the Expo
At Web 2.0 Expo, we will be showcasing FusionCharts v3.2, the latest and the most powerful avatar of FusionCharts, and FusionCharts for SharePoint. The
latest avatar of FusionCharts takes your charts beyond Flash, giving you the best of the JavaScript world as well. This makes your charts ready for the iPad and the iPhone too. FusionCharts v3.2 also includes many industry firsts like
LinkedCharts – a method to create unlimited levels of drill-down charts using a single data source in seconds. With
FusionCharts for SharePoint, we’ve made creating dashboards within SharePoint a breeze. It allows you to codelessly connect to multiple data sources, select the right chart for your data and then configure it. Moreover, we would like to talk to you and understand your current data visualization requirements and how you see them evolving. In case you are using FusionCharts already, we would love to know how and where you are using it. And being the geeks that we are, we would love to talk about technology and its implications as a whole.
Our first time ever in the US
This is the first time ever we are visiting the US, so we decided to spend an entire week in SF instead of just the 29th & 30th at the expo.
Pallav,
Deb and
Sanket (oh, that’s me) will be arriving in SF on 26th March itself and we will be around till 1st April. We have taken the extra time to ensure that we get to meet as many of you as possible, put a face to the voice we have been hearing on phone and get to know you in person, which is how we like doing business. We also wanted to understand the Valley culture and party with all you awesome folks there. All our friends and partners in the Valley have been such great help in putting together our SF plans (they invited us for dinner too), and we found some incredible resources on the web as well:
However, we want to make sure that we don’t miss out anything in SF. So do let us know of all the whacky things to do and the cool places to go to in the comments. I really look forward to it. [Discreet note: We are also going to Vegas for a couple of days after SF, so do tell me of places there too]
Come meet us there
To put everything together, we will be exhibiting at the Web 2.0 Expo on Mar 29th & 30th at Moscone West Convention Center, San Francisco. The expo timing is 10 PM – 3.30 PM and we are at booth #514. So if you are there at the expo, you have to come to our booth. In case you are not coming to the expo but are in SF and would like to meet us, just drop a line in the comments. We will get in touch with you and set up a time to meet somewhere in SF. As the event gets closer, we will be sharing a lot more details and updates on
Twitter. So in case you are not following us already, you should now.
View Comments
I still think the stunning girl works best on the t shirt!
I like how you describe the t-shirt :) Thanks for your feedback, and if we have more feedback on similar lines, we will be forced to think over our pick again.
Super Guys! All of the designs are stunning, really. Next time we meet up, I think I will want one of those. No, two actually. All the best for the Expo!!
Sure thing....thanks so much :)
I liked the 2nd and 4th T-shirt. And if you like to give me one i would prefer 4th one :).
I like T-Shirt Number Two. It has an added attitude. :P
The T-Shirt ...the one with girl will go best :D
I liked the 2nd one. It has got an extra bit of aggressiveness along with the right attitude reflecting from its tag-lines :)
Row 1 design...company logo in the front and the girl in the back leaves a lasting impression :-)
I like the last two T-Shirts. I think they are the best!
Obviously the one with the chic ! ;)
The 2nd and the 4th are best for promoting the essence of your company while the 1st one is something you should send as gift to all who are commenting here :)