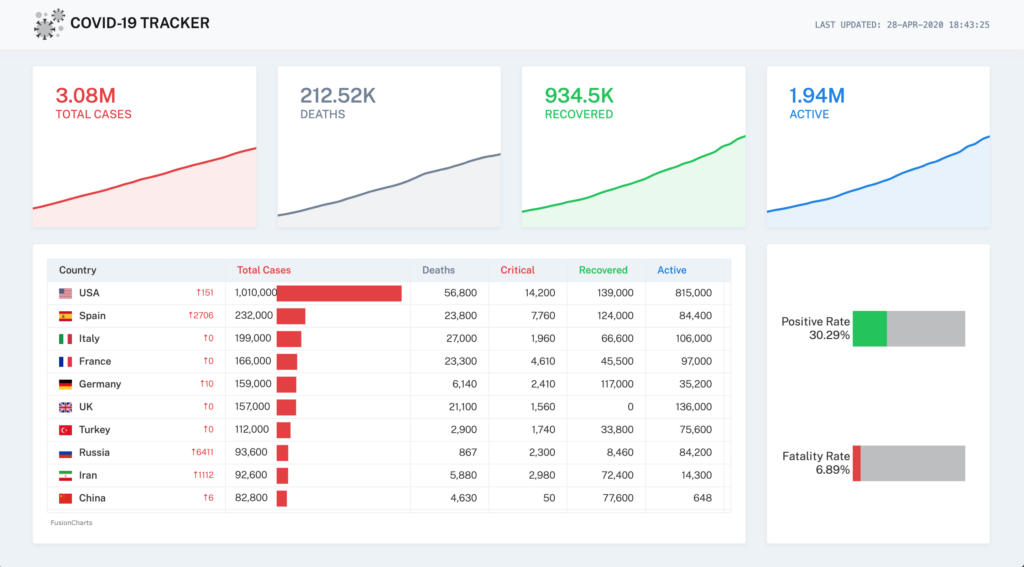
FusionCharts Suite XT
FusionCharts helps you build beautiful dashboards for your web & mobile projects. With extensive documentation, cross-browser support, and a consistent API, it is easier than ever to add interactive and responsive charts. From simple charts like line, column, and pie to domain-specific charts like heatmaps, radar, and stock charts we’ve got you covered. Start building your dashboards with FusionCharts today.
What do you get with FusionCharts Suite XT?
Why do 800,000 developers and 28,000 organizations love FusionCharts?
Easily Integrate with any JavaScript framework or server-side programming language
Back-end integrations
Why should you choose FusionCharts products?
There are over 800,000 developers from 28,000+ companies prefer FusionCharts products over Open source or other paid libraries. Here are a few reasons:
- 15 minutes to first chart, without any learning curve. Plus, consistent API across different charts make it simple to build complex charts or dashboards.
- Consistent look & feel. Our themes have a consistent look across products. Did we tell you that you can also build your own theme?
- Various installation options available (direct JavaScript, CDN, NPM) and pre-integrated with all popular JavaScript libraries and back-end programming languages
- Comprehensive documentation for each library or programming language, with a lot of live-examples.
- Ready-to-use chart examples, industry-specific dashboards and even data stories, available with source code for you to quickly get started.
Love from Our Customers
Thank you for all your help!! This is what I call GREAT customer service. I am very glad Dell decided to purchase this product as your help has made it worth every penny.
Ryan Jeffords,
This is a great application, it saves a lot of time and although I would like to say the 'Wow' factor is because of the great data I provide; I know that it is more likely due to the presentation that FusionCharts has made possible.
Jonathan Rickard,
Best money I have ever spent on a useful piece of application software. Ideal for the management reporting that Electric Penguin delivers to its clients.
Paul Smith,
FusionCharts and [Fusion]Maps offered us a clean and dynamic way of displaying information on our site. We used a combination of drill-down maps and charts to create a very interactive model of Native American Service Centers across the US. We could not have done it without Fusion components.
Cherylyn Stoltman,