FusionCharts Suite XT has always provided better charting solutions to ease the process of data visualization. Our team frequently comes up with new ways to implement FusionCharts according to your usage requirements, like in this tutorial.
This tutorial showcases how you can render charts using FusionCharts in Microsoft Xamarin.
Table of Contents
Xamarin is a platform to write native Android, iOS, and Windows apps with native user interfaces. These codes can be shared across multiple platforms. Also, the Xamarin platform supports the development of mobile applications for the above-mentioned platforms, based on the .NET framework.
In March 2016, Microsoft acquired Xamarin with the goal of bringing cross-platform mobile development to the wider Microsoft developer community. Do you want some good news? Xamarin Forms is now available to all Visual Studio users for free.
Let’s now get started with the requirements and the steps to render charts using FusionCharts in Microsoft Xamarin.
Before we start with creating and rendering FusionCharts using the Xamarin platform, we need to make sure that we have the following components downloaded on our local machine:
We’ll create a simple chart that showcases the monthly revenue for Harry’s SuperMart for a year. Let’s follow these steps to create a column 2D chart using the Xamarin platform:
Create a new project.
Click File -> New. The File menu renders.
Select Project
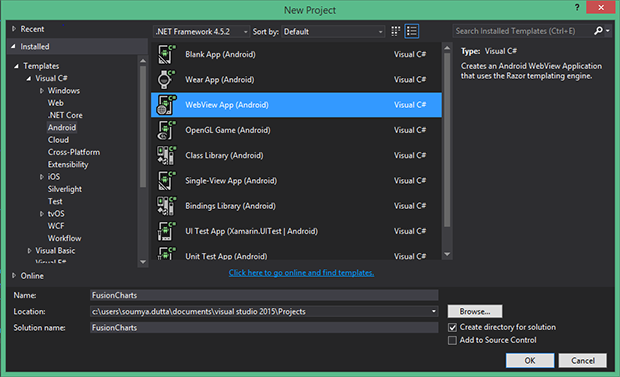
The image below outlines the steps:
Select Android under the installed template within Visual C# and select WebView App(Android). Please refer to the image below:
Next, give a name to the project (FusionCharts in our case) and save it to the desired location in your system.
From the View menu, open Solution Explorer and locate the assets folder.
Insert the fusioncharts.js and fusioncharts.charts.js files within the Assets folder. Please see the image below:
Search for the RazorView.cshtml file in the Views folder, which is a view component. Also, it will be used for rendering the chart within the WebView component.
In RazorView.cshtml file create a label and a button within a <div> tag. Place it in the <form> tag as shown below:
<html>

<body>
    <div data-role="page" data-theme="b">
        <form>

            <div data-role="content">

                <h1 id="label">@Medel.Text</h1>
                <input type="button" name="chart" value="Chart" >
Step 8
Include the fusioncharts.js and fusioncharts.charts.js libraries within <head> tag of RazorView.cshtml. //
// ]]>//
// ]]>//
// ]]> Step 9 Declare a JavaScript function, getChart(), and define the entire FusionCharts JSON code (chart data) there. Step 10 In MainActivity.cs file create a WebView object instance. Set the JavaScript.Enabled property to true for WebView settings, as shown below: var webView = FindViewById<WebView>(Resource.Id.webView);
webView.Settings.JavaScript.Enabled = true;
 Step 11 Render the view that has been generated from RazorView. This can be done by including the following code in MainActivity.cs: var model = new Model1() { Text = "Please click chart button to render chart..." };
var template = new RazorView() { Model = model };
var page = template.GenerateString();
 Step 12 Load the rendered HTML into the view with a base URL that points to the root of the bundled Assets folder, as shown in the code below: webView.LoadDataWithBaseURL("file:///android_asset", page, "text/html", "UTF-8", null);
 Step 13 Define the subclass of the WebViewClient to render the view generated from RazorView.cshtml as shown below: private class HybridWebViewClient: WebViewClient {
    public override bool ShouldOverrideUrlLoading(WebView webView, string url) {
        // If the URL is not our own custom scheme, just let the webView load the URL as usual
        var scheme = "hybrid:";

        if (!url.StartWith(scheme))
            return false;
        // This handler will treat everything between the protocol and "?" as the method name. The querystring has all f the parameters.

        var resources = url.Substring(scheme.Length).Split('?');
        var method = resources[0];
        var parameters = System.Web.HttpUtility.PparseQueryString(resources[1]);
        return true;
    }
}
 Step 14 Save the application and run the project using the Android_Accelerated_x86 6.0 emulator. Now, you are ready to run the application created. While you are in the emulator, press ctrl + f5. to run and start the FusionCharts app as shown in the image below:  Viewing the Chart We are all set to render the chart now!

All you need to do is click the Chart button, you should be able to see your output.

The output should look as shown in the image below:
A well-designed dashboard helps users understand complex data quickly, monitor key performance indicators, and make…
Quick Answer: The best commercial chart libraries for Nuxt include FusionCharts, Highcharts, AnyChart, amCharts, ApexCharts,…
Quick Answer To integrate interactive Vue charts into a Vue 3 application, first create a…
If you're looking for the best Vue chart library for interactive data visualization, there isn't…
Modern web applications generate and display more data than ever. They create from business dashboards…
Businesses collect data from multiple sources every day, including sales platforms, marketing tools, customer support…