Table of Contents
package fusioncharts;

/**
 *
 * @author fusioncharts
 */
import java.io.IOException;
import javax.servlet.ServletException;
import javax.servlet.http.HttpServletRequest;
import javax.servlet.http.HttpServletResponse;
import org.springframework.web.servlet.ModelAndView;
import org.springframework.web.servlet.mvc.Controller;

public class chartscontroller implements Controller{
    @Override
    public ModelAndView handleRequest(HttpServletRequest request, HttpServletResponse response) throws ServletException, IOException {
        return new ModelAndView("/WEB-INF/jsp/index.jsp");
    }

     public String chartmaker(){
        FusionCharts lineChart= new FusionCharts(
            "line",// chartType
            "chart1",// chartId
            "600","350",// chartWidth, chartHeight
            "chart",// chartContainer
            "jsonurl",// dataFormat
            "data.json"
            );


        return lineChart.render();
    }

}
data.json {
"chart": {
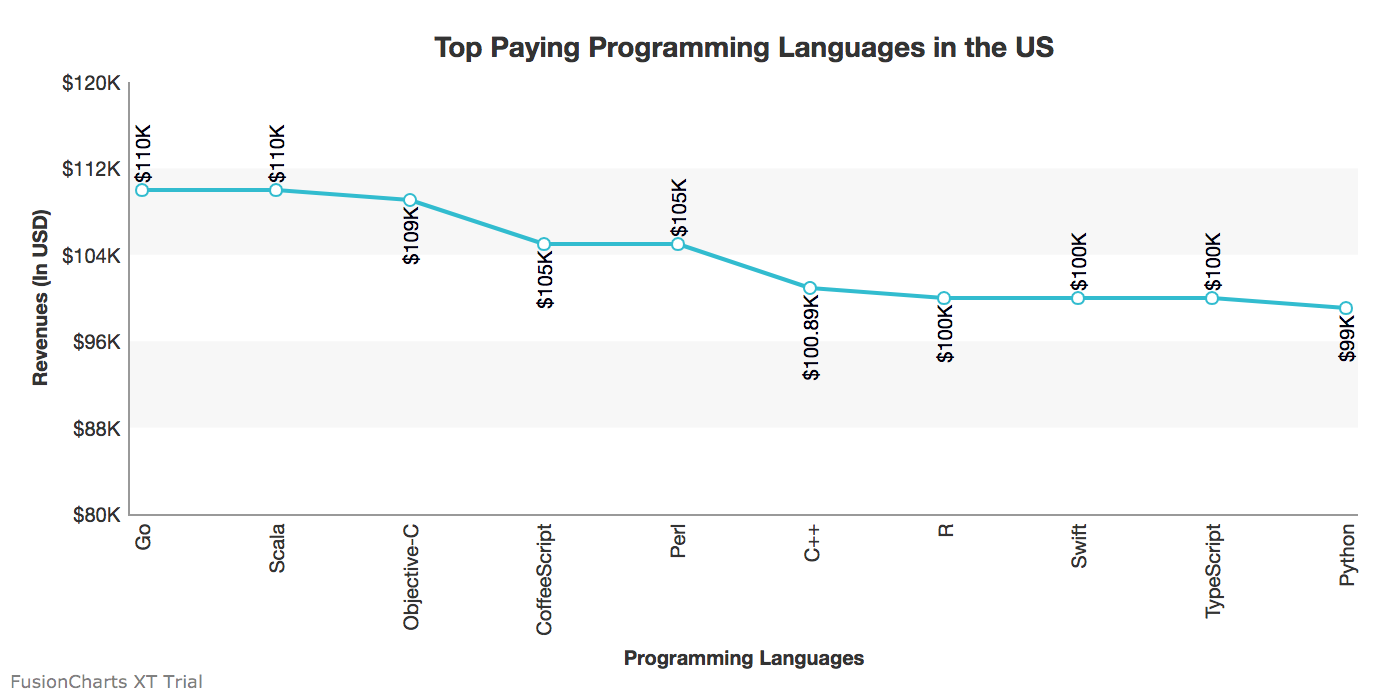
"caption": "Top Paying Programming Languages in the US",
"theme": "fint",
"xAxisName": "Programming Languages",
"yAxisName": "Revenues (In USD)",
"numberPrefix": "$",
"paletteColors": "#25BCD1",
"bgColor": "#ffffff",
"borderAlpha": "20",
"canvasBorderAlpha": "0",
"usePlotGradientColor": "0",
"plotBorderAlpha": "10",
"placevaluesInside": "1",
"rotatevalues": "1",
"rotateLabels": "1",
"valueFontColor": "#00000",
"showXAxisLine": "1",
"xAxisLineColor": "#999999",
"yAxisLineColor": "#999999",
"divLinealpha": "0",
"yaxisminvalue": "80000",
"showAlternateHGridColor":"1",
"showYAxisLine":"1"
},
"data": [{
"label": "Go",
"value": "110000"
}, {
"label": "Scala",
"value": "110000"
}, {
"label": "Objective-C",
"value": "109000"
}, {
"label": "CoffeeScript",
"value": "105000"
}, {
"label": "Perl",
"value": "105000"
}, {
"label": "C++",
"value": "100890"
}, {
"label": "R",
"value": "100000"
}, {
"label": "Swift",
"value": "100000"
}, {
"label": "TypeScript",
"value": "100000"
}, {
"label": "Python",
"value": "99000"
}]
}
<%@page import="fusioncharts.chartscontroller"%>
<%@page contentType="text/html" pageEncoding="UTF-8"%>
<%@page import="fusioncharts.FusionCharts" %>
<!DOCTYPE html>
<html>
    <head>
        <title>FusionCharts || www.fusioncharts.com</title>
        <script src="fusioncharts.js"></script>
        <script src="fusioncharts.charts.js"></script>
        <script src="fusioncharts.theme.fint.js"></script>

    </head>
    <body>
         <div id="chart"></div>
        <%

         chartscontroller a= new chartscontroller();
         out.println(a.chartmaker());
         %>

 </body>
</html>
Note: Ensure that you import the Fusioncharts wrapper in the JSP page and include the FusionCharts JS library files. To create pie charts and generate statistical data, you’ll find this list of the best…
To implement FusionCharts in a dynamically resizing flexbox layout, ensure that the chart's dimensions are…
At FusionCharts, we believe in empowering developers and businesses with cutting-edge data visualization tools that…
Ever had a data set that seemed more complicated than a Rubik's cube? You’re not…
We’ve all seen them in textbooks or presentations—those overlapping circles that simplify complex information into…
We’re excited to announce the upcoming release of FusionCharts v4.1—a groundbreaking step forward in the…