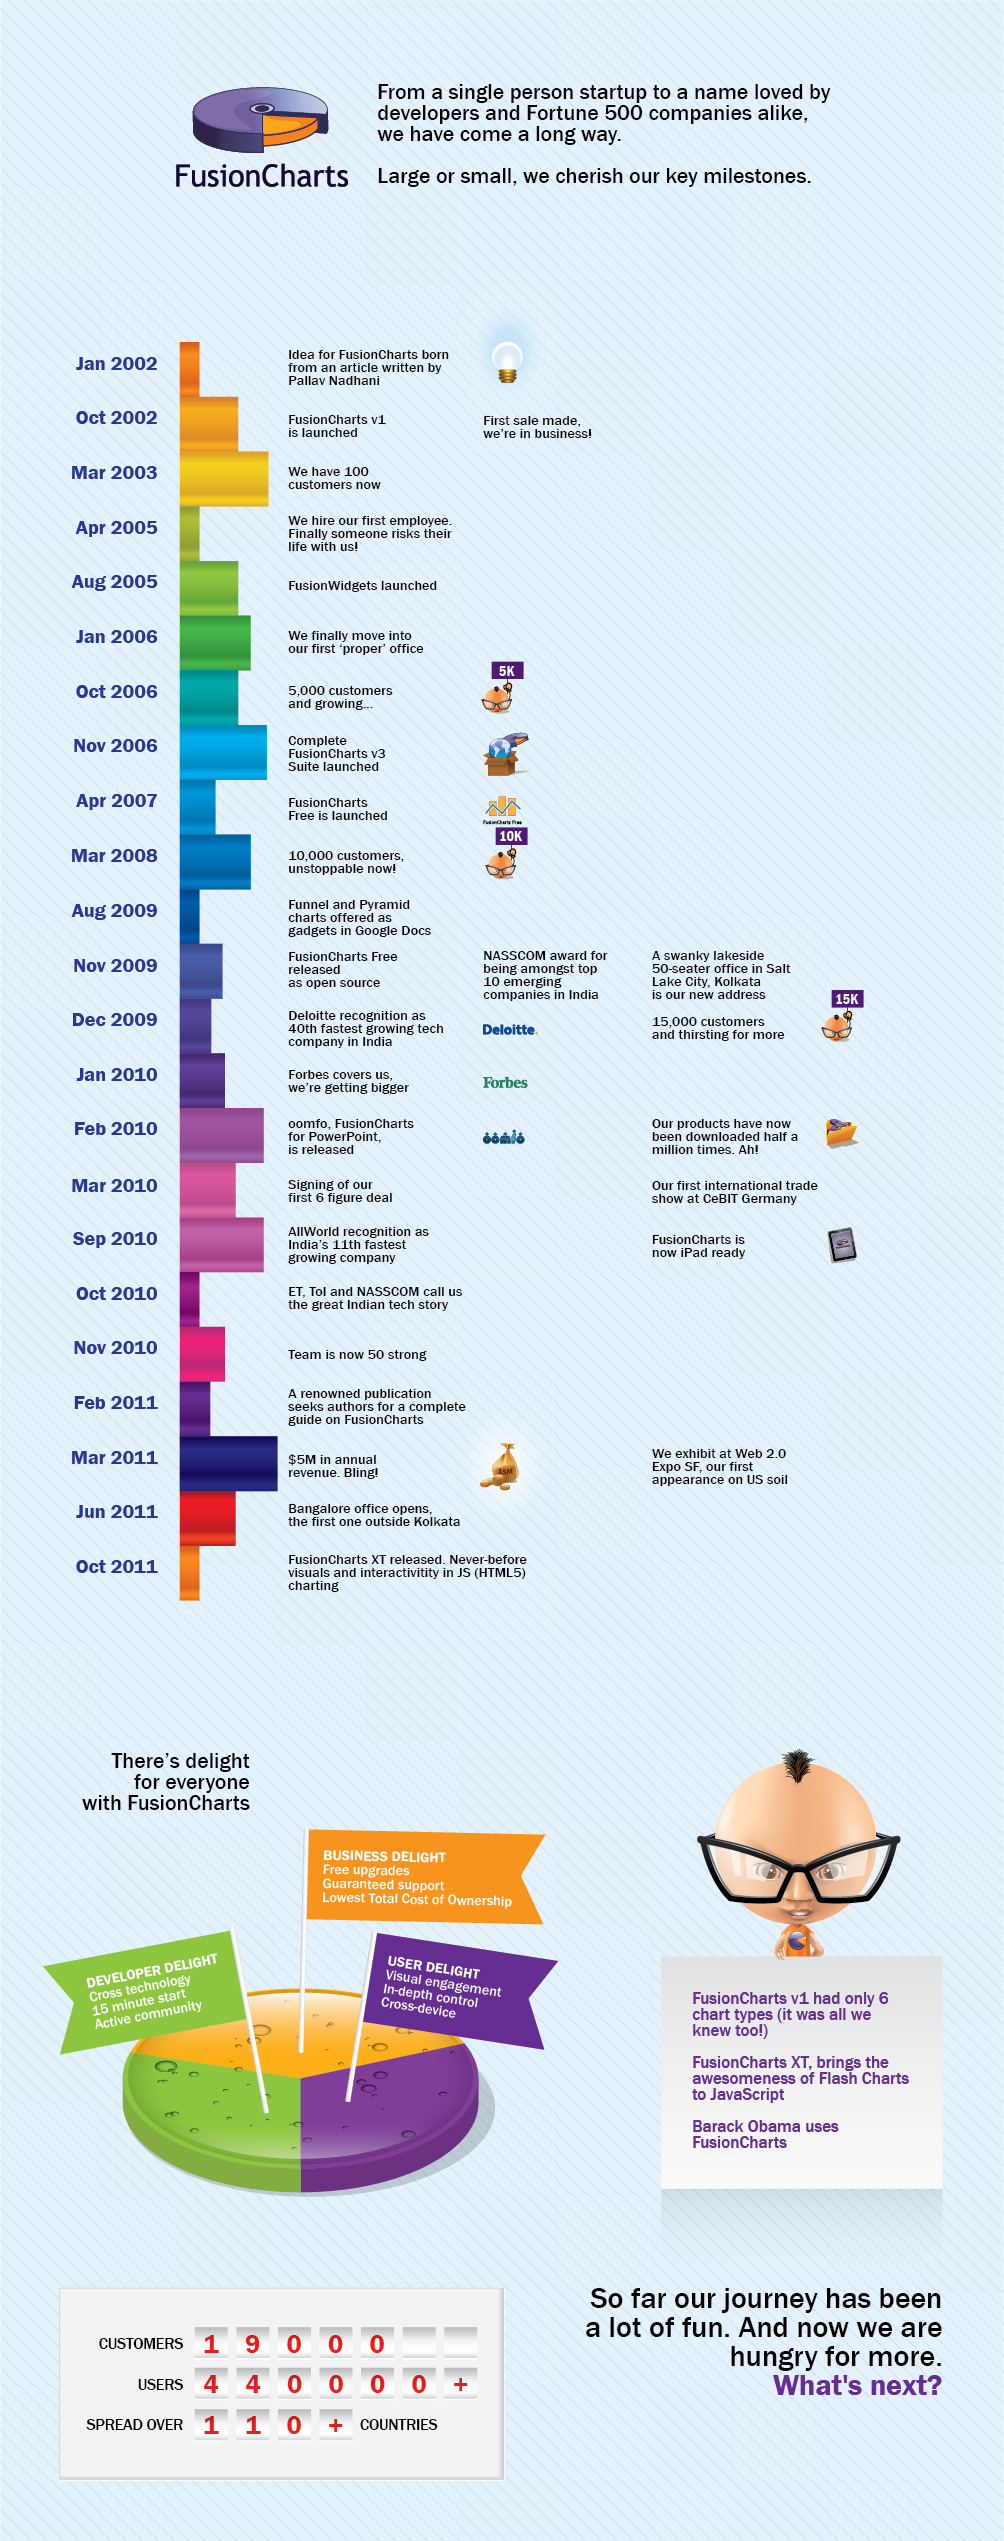
We’ve landed with a bang in the 10th year of making data look cool. Yes, today we complete 9 years as a company.
It was a mighty awesome year we had. We moved to our new Bangalore office, expanded our team and released FusionCharts v3.2.1 in January, followed by FusionCharts XT earlier this month. Being almost a decade old makes us proud and humbled at the same time. Here’s an infographic showcasing our proudest moments and milestones over the past 9 years…
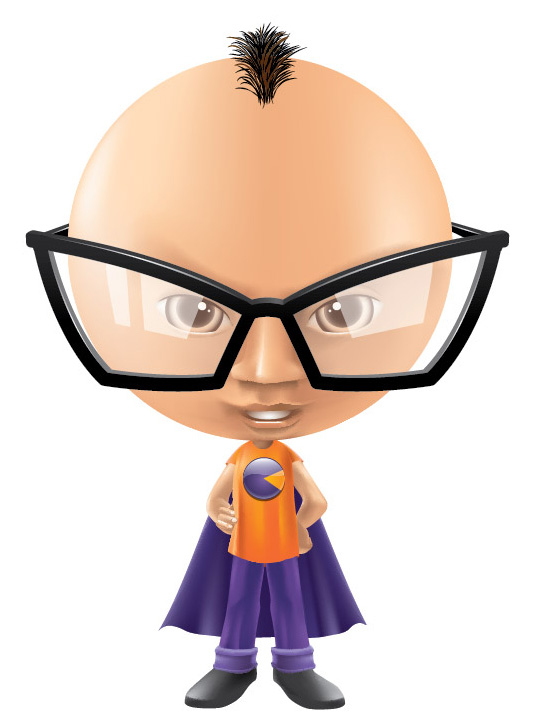
9th Birthday Easter Egg
Noticed the little dude in the picture? In so many ways he is what FusionCharts is. Peek below to know him better!
But our dude is currently nameless, and the way we’ve come to love him we can’t let that continue, can we? ‘Dude’ is good but then it isn’t nice calling a fellow being just ‘Dude’, right?
We tried Bubu- the awesomest guy on the internet, but he didn’t like the sound of it. We then tried Chikna, you know, the looker dude appeal, but got some blank stares when we passed it around. No one liked it.
And now we’ve ended up with as little hair as him, scratching our heads for the right nick. Care to help us save what’s left of our hairline? All you got to do is head over to our Facebook page and suggest or vote on some options.
Oh, and since it’s serious business with us we ‘re also giving away some really nice dude-cool t-shirts to 9 lucky winners this week. You don’t turn 9 every year, do you?
We’re kicked to know what you guys will come up with and so is the Dude (you bet!). See you on Facebook then.
Oh, and yes, happy birthday to us and thanks for your wishes too! 🙂
You can build complex web applications easily with Angular. But it’s a challenge to present…
JavaScript charts help transform raw data into clear, interactive visualizations that users can easily understand.…
Modern web applications depend on data visualization to transform complex information into clear, actionable insights.…
Data is a big part of modern software. Companies use charts to track sales, monitor…
Every day, businesses get more data than ever before. Looking at endless rows and columns…
Building interactive React charts from scratch can quickly become complicated. It becomes even more challenging…
View Comments
How about:
1) Fusion Man...its a bird...its a plane...et al?
2) Mr. Chartographer (check https://dictionary.reference.com/browse/chartographer)
3) Fusiondrawachartix...[an unknown behind the scenes (lost at birth) brother of Asterix]
4) Chart wan Kenobi
5) Da Kewl FusionCat
How 'bout "Chartilator"..the next best thing to happen since Calculator (which can be used as a tagline too)