Understanding the World Better
Data Story by FusionCharts
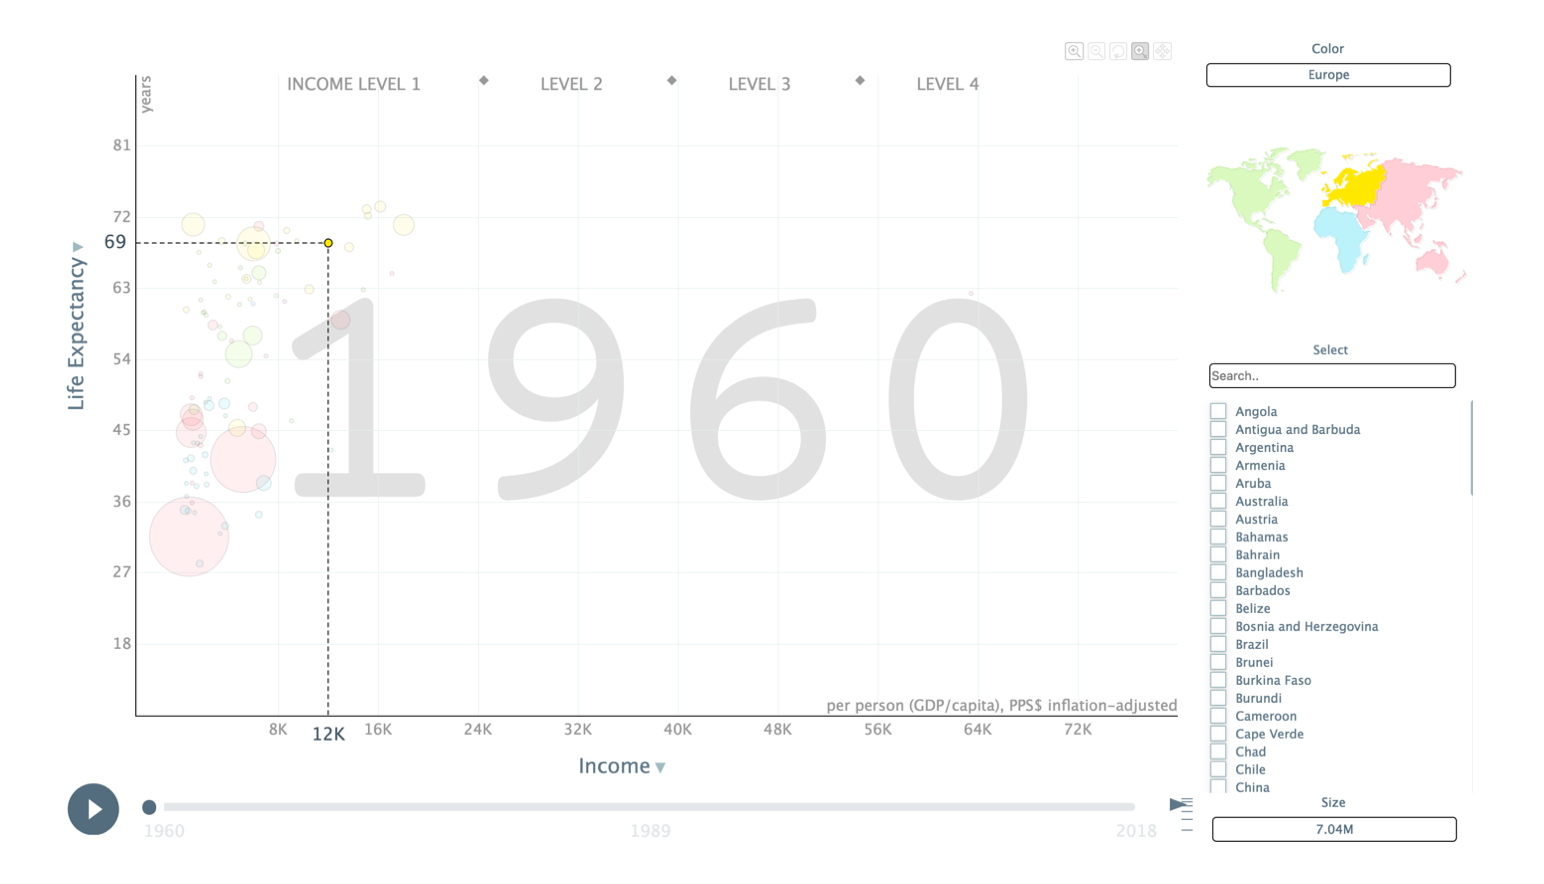
This tool by Gapminder Foundation helps people explore and understand the world better. One can explore with various parameters including, income per person, life expectancy, population, human development index, military expenditure (as % of GDP) of all the countries categorized into world regions and income groups over the last two centuries. We built something similar with FusionCharts library, and one would be amazed to use it!
This sample dashboard is built using FusionCharts Suite XT, which needs a license for commercial use.
Want to use this Data Story in your projects?
We can plug in your data into our data story templates, or customize the template for your needs, or even build a completely new one. We would love to talk to you!