React Graph Component for FusionCharts
How To Create a Chart In React Using FusionCharts
Follow along as we guide you through the step-by-step process, from installing the FusionCharts library to integrating and customizing graphs within your React application. Watch now to unlock the power of data visualization and enhance your react graph.Interactive examples and Code Snippets
React Component For FusionCharts - Key Features & Benefits
A React component is a fundamental building block for building user interfaces in React applications. It encapsulates reusable UI elements, logic, and behavior, allowing developers to create modular and maintainable code. React Component for FusionCharts provides a seamless integration into React applications.
It enables developers to easily create interactive and visually appealing charts by leveraging the declarative nature of React. With intuitive APIs and extensive customization options, developers can efficiently build dynamic data visualization solutions within their react graph.
React Charts Features
- Diverse chart types with trendlines and annotations
- Easy customization of color, labels, tooltips, and animations
- Comprehensive documentation and community support
- Robust error handling for unexpected scenarios
- Consistent rendering across browsers
Premium Features of React Charts
- Priority support for timely assistance
- Access to premium templates for professional visualizations
- Consistent rendering across browsers
- Additional options for refining chart appearance and behavior
Why Choose FusionCharts’s React Graph
- Keeps all chart elements in sync for data binding
- Provides seamless interactivity between charts
- Consists of multiple data types from JSON URL to Prop Array Binding
- Single Angular.js directive for adding charts and maps
- Advanced control with full access
Features of the integration
Single directive for everything
Add charts and maps using single Angular.js directive
Support for data binding
Keep all your chart elements in sync with native support for Data Binding.
Multiple data types
Insert charts from a JSON URL, an XML URL, or using Props Array Binding.
Add interactivity with ease
Enable interactivity between charts with hundreds of events and methods
Complete control over configurations
Enjoy advanced control with full access to FusionCharts object that contains complete chart configurations.
Build 100+ charts and 2000+ maps
Go beyond column charts and pie charts with our 100+ charts made for any kind of data. From area to donut and marimekko to radar, we’ve got all your charting needs covered. Don’t just stop at charts, with 2000+ maps, gauges and more, your dashboards and reports will become more meaningful and insightful.

Chart Gallery
Explore 100+ charts for your React application

Time Series Gallery
Explore how to plot millions of data on a time-series chart in React

Maps Gallery
Render 2000+ Maps for your React project


Explore dashboards made with React
We have built over 20+ dashboards for various industries and use-cases. The best part of these dashboards? They are open source and completely free to use! Just download them and explore how you can use React Charts for FusionCharts in the real-world.
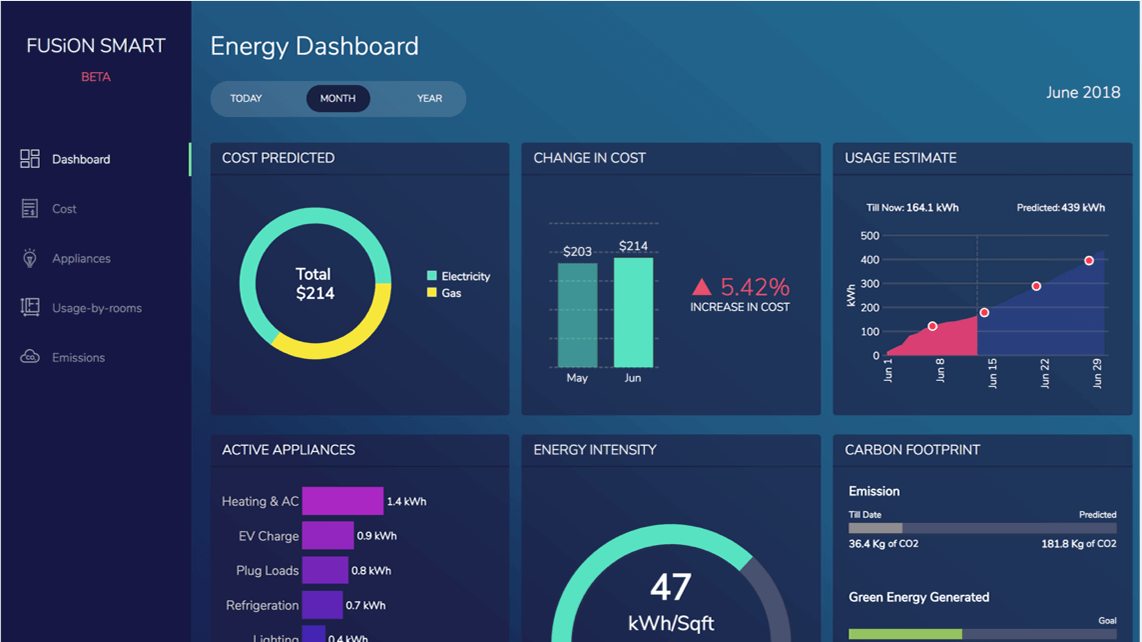
Smart Energy Dashboard
Improve visibility for energy consumption and costs with our Smart Energy Dashboard.

SaaS Dashboard
Track and monitor important metrics of an organization in React

Web Series Dashboard
The performance of web series’ in terms of subscribers, revenue, IMDb rating and Emmy awards


Ready to Get Started?
Frequently Asked Questions
Is FusionCharts compatible with React?
Yes, FusionCharts provides comprehensive support for React applications. Using dedicated components and APIs, you can easily integrate FusionCharts into your react graph.Can I handle data updates and interactivity in React graph with FusionCharts?
FusionCharts provides robust data handling and interactive features, including real-time updates, drill-down capabilities, and event handling. You can seamlessly manage data changes and user interactions to create dynamic and engaging chart experiences in React.
Can I customize the appearance of charts in React with FusionCharts?
Absolutely! FusionCharts offers extensive customization options, allowing you to tailor charts' appearance, style, and behavior to suit your project's requirements.