Table of Contents
chart.html. In the HTML file, include a chart instance that will render the chart in our app inside WKWebView, which we will learn to create later. First, we will include the core packages in our HTML file and then create a chart instance. <html> <head> <!-- including FusionCharts core package JS files → <script src="fusioncharts.js"></script> <script src="fusioncharts.widgets.js"></script> </head> </html>Note: Please copy the files downloaded to the project folder. Ensure that the path specified in chart.html for FusionCharts core package JS files is accessible to the application. Also include these files in Build Phases -> Copy Bundle Resources.
<!-- chart instance -->
<script>
FusionCharts.ready(function() {
var appChart = new FusionCharts({
type: 'doughnut2d',
width: '100%',
height: '350',
renderAt: 'chartContainer',
dataFormat: 'json',
dataSource: {
"chart": {
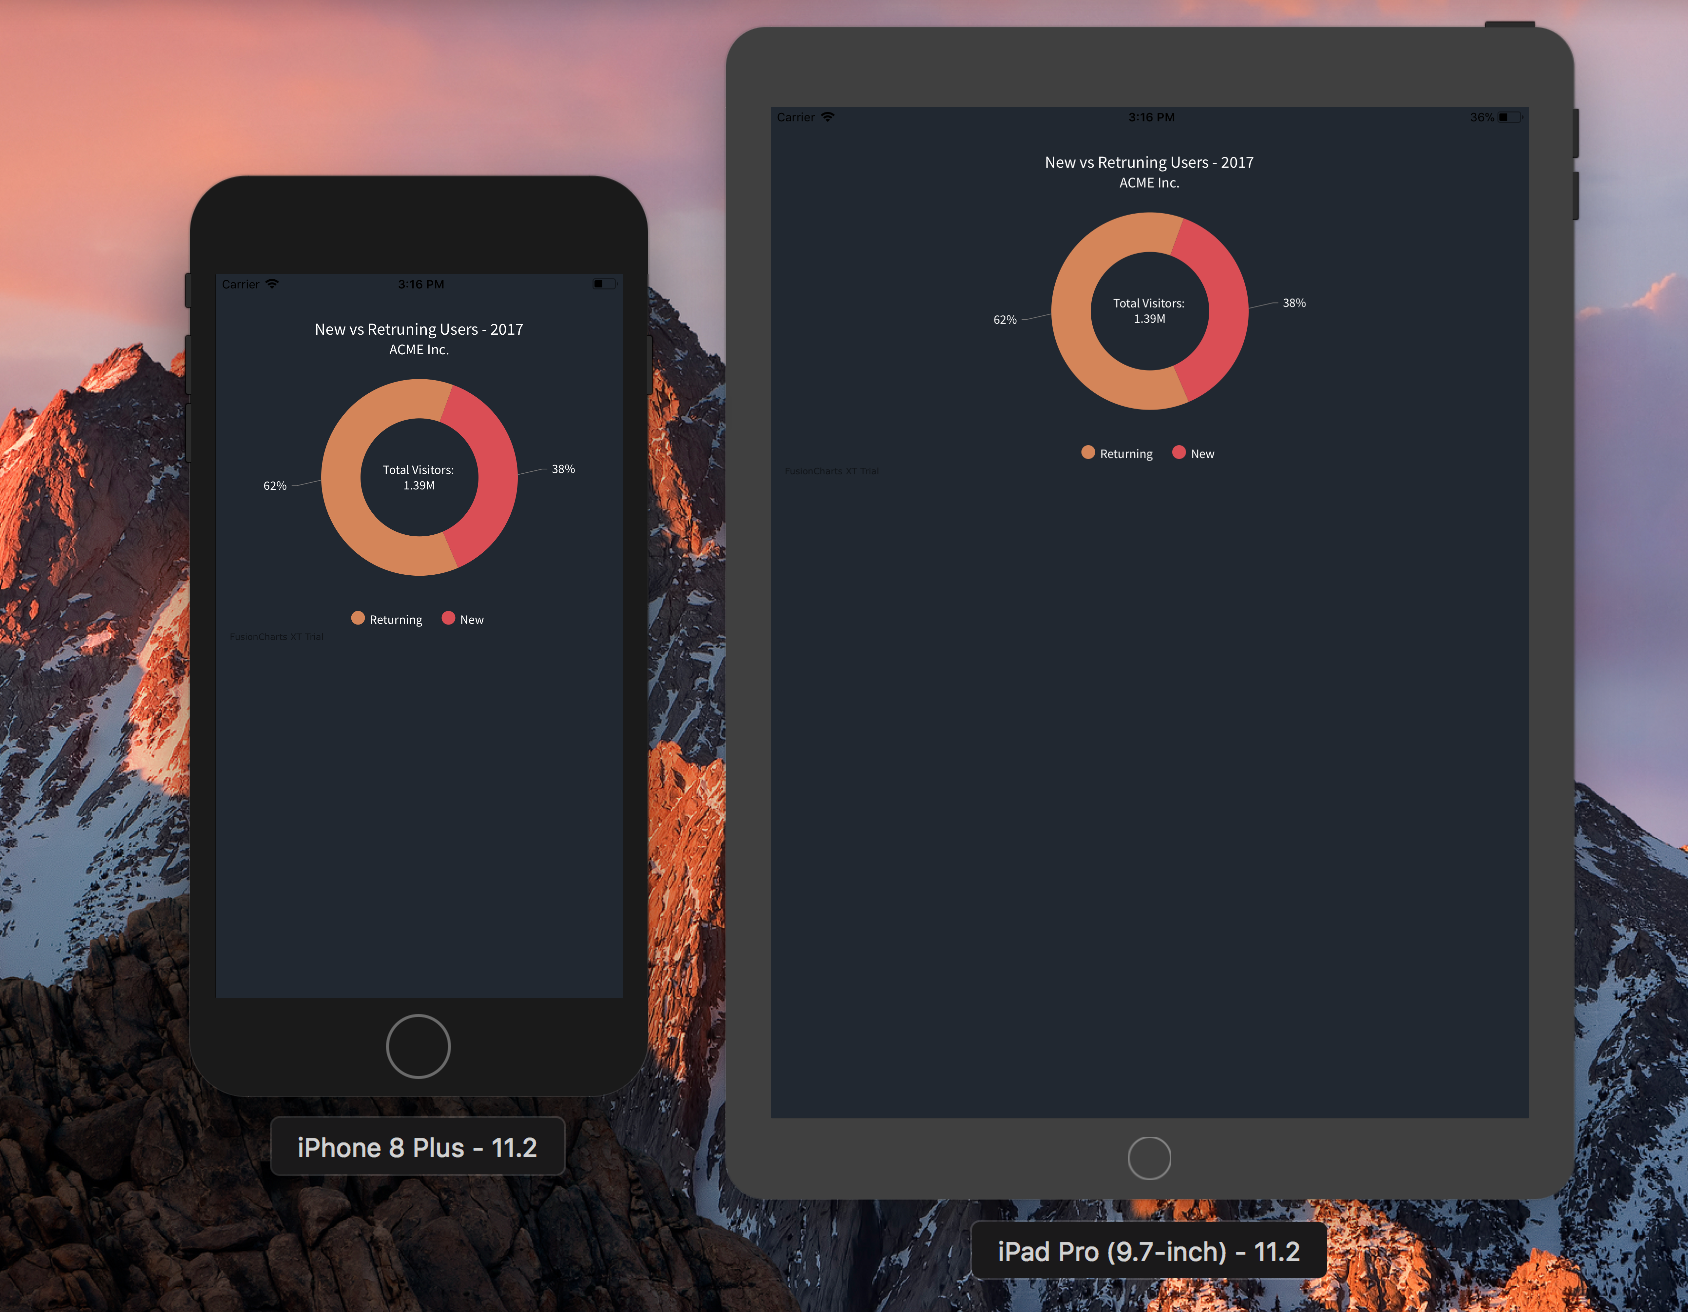
"caption": "New vs Retruning Users - 2017",
"captionFontSize": "17",
"captionFontBold": "0",
"subCaption": "ACME Inc.",
"subCaptionFontSize": "15",
"paletteColors": "#D68554, #DC4D52",
"bgColor": "#212831",
"canvasBgColor": "#212831",
"bgAlpha": "100",
"canvasBgAlpha": "0",
"showBorder": "0",
"showLabels": "0",
"showLegend": "1",
"legendBorderAlpha": "0",
"legendShadow": "0",
"use3DLighting": "0",
"showShadow": "0",
"drawCustomLegendIcon": "1",
"pieRadius": "100",
"doughnutRadius": "60",
"showPercentValues": "1",
"legendIconSides": "2",
"legendIconBorderThickness": "0",
"baseFont": "Source Sans Pro",
"defaultCenterLabel": "Total Visitors: 1.39M",
"centerLabel": "$label Visitors: $value",
"centerLabelBold": "0",
"baseFontSize": "13",
"startingAngle": "70",
"enableSlicing": "0",
"legendBgAlpha": "0",
"baseFontColor": "#FFFFFF",
"showTooltip": "0",
"showPlotBorder": "0"
},
"data": [
{
"label": "Returning",
"value": "862736.82"
},
{
"label": "New",
"value": "528774.18"
}
]
}
}).render();
});
</script>
Given below is the complete HTML code of chart.html: <!doctype html>
<html>
<head>
<title>FusionCharts - iOS Example</title>
<meta name="viewport" content="width=device-width, initial-scale=1">
<!-- including FusionCharts core package JS files -->
<script src="fusioncharts.js"></script>
<script src="fusioncharts.charts.js"></script>
<style>
@import url('https://fonts.googleapis.com/css?family=Source+Sans+Pro');
body { background-color: #212831; }
</style>
<!-- chart instance -->
<script>
FusionCharts.ready(function() {
var appChart = new FusionCharts({
type: 'doughnut2d',
width: '100%',
height: '350',
renderAt: 'chartContainer',
dataFormat: 'json',
dataSource: {
"chart": {
"caption": "New vs Retruning Users - 2017",
"captionFontSize": "17",
"captionFontBold": "0",
"subCaption": "ACME Inc.",
"subCaptionFontSize": "15",
"paletteColors": "#D68554, #DC4D52",
"bgColor": "#212831",
"canvasBgColor": "#212831",
"bgAlpha": "100",
"canvasBgAlpha": "0",
"showBorder": "0",
"showLabels": "0",
"showLegend": "1",
"legendBorderAlpha": "0",
"legendShadow": "0",
"use3DLighting": "0",
"showShadow": "0",
"drawCustomLegendIcon": "1",
"pieRadius": "100",
"doughnutRadius": "60",
"showPercentValues": "1",
"legendIconSides": "2",
"legendIconBorderThickness": "0",
"baseFont": "Source Sans Pro",
"defaultCenterLabel": "Total Visitors: 1.39M",
"centerLabel": "$label Visitors: $value",
"centerLabelBold": "0",
"baseFontSize": "13",
"startingAngle": "70",
"enableSlicing": "0",
"legendBgAlpha": "0",
"baseFontColor": "#FFFFFF",
"showTooltip": "0",
"showPlotBorder": "0"
},
"data": [
{
"label": "Returning",
"value": "862736.82"
},
{
"label": "New",
"value": "528774.18"
}
]
}
}).render();
});
</script>
</head>
<body>
<!-- chart container -->
<div id="chartContainer">Chart will render here!</div>
</body>
</html>
ViewController.swift: import WebKit While creating the web view, store it as a property for later reference. Add the property of web view to ViewController class. Refer to the following command: var webView: WKWebView! Now, we will add loadView( ) before viewDidLoad(). Refer to the following command: override func loadView() {
let webConfiguration = WKWebViewConfiguration()
webView = WKWebView(frame: .zero, configuration: webConfiguration)
webView.uiDelegate = self
view = webView
}
Include override keyword for loadView() to load the layout from the storyboard. To load the chart in webView, insert the code given below to refer the HTML file (chart.html) created in the viewDidLoad() method: let webView = WKWebView() let htmlPath = Bundle.main.path(forResource: "charts", ofType: "html") let htmlUrl = URL(fileURLWithPath: htmlPath!, isDirectory: false) webView.loadFileURL(htmlUrl, allowingReadAccessTo: htmlUrl) view = webViewGiven below is the complete code for webView( ):
import UIKit
import WebKit
class ViewController: UIViewController, WKUIDelegate {
var webView: WKWebView!
override func loadView() {
let webConfiguration = WKWebViewConfiguration()
webView = WKWebView(frame: .zero, configuration: webConfiguration)
webView.uiDelegate = self
view = webView
}
override func viewDidLoad() {
super.viewDidLoad()
let webView = WKWebView()
let htmlPath = Bundle.main.path(forResource: "charts", ofType: "html")
let htmlUrl = URL(fileURLWithPath: htmlPath!, isDirectory: false)
webView.loadFileURL(htmlUrl, allowingReadAccessTo: htmlUrl)
view = webView
}
override func didReceiveMemoryWarning() {
super.didReceiveMemoryWarning()
// Dispose of any resources that can be recreated.
}
}
To create pie charts and generate statistical data, you’ll find this list of the best…
To implement FusionCharts in a dynamically resizing flexbox layout, ensure that the chart's dimensions are…
At FusionCharts, we believe in empowering developers and businesses with cutting-edge data visualization tools that…
Ever had a data set that seemed more complicated than a Rubik's cube? You’re not…
We’ve all seen them in textbooks or presentations—those overlapping circles that simplify complex information into…
We’re excited to announce the upcoming release of FusionCharts v4.1—a groundbreaking step forward in the…
View Comments
Awesome tutorial and library. I`ve been using it for a school project where I have to show a Bar Chart and a Spreadsheet like report, where it explains the data shown in the Chart.
But I`ve been having some trouble to show the webView inside a containerView and not as the whole view.
Could you help me with that?
Definitely Joel. Please drop an email to support@fusioncharts.com mentioning the issue you are facing. We’ll try our best to make it work for you.
Thanks.