
It’s 2018, and the world has officially gone mobile.
Smartphones are used by approximately 56% of us to access the internet. At the time of writing, iTunes had over 2 million apps. Surprisingly, business is the most popular category after gaming – an area ripe for data analyses and insightful visualizations.
You could use a chart if you’re targeting individuals or organizations, creating a weather app, a stock market monitoring tool, or a powerful tool for monitoring on-floor performance. To stand out from the crowd, you need apps that are not only useful but also visually appealing – (and brownie points, if it does both ).
If you’re still not convinced of the power of iOS visualization, check out this stunning responsive visualization of all the data on Wikipedia.
FusionCharts makes interactive charting easy, customizable, and exciting – use these steps to create visuals that will fit seamlessly into your next iOS app. This tutorial shows how to use FusionCharts to create interactive charts for iOS apps.
As you read this post, you’ll discover the fundamental requirements as well as how to create interactive graphs and charts on iOS devices.
Table of Contents
Requirements
Before we start the step-by-step procedure to create interactive charts in iPhone or iPad apps, make sure that you have the following components downloaded in the local machine:
- FusionCharts XT [Download Link]
- Xcode [Download Link]
Step 1: Create a Project in XCode
Once you have Xcode installed on your system, open it and create a new xcode project with the ‘Single View App’ template.
Step 2: Create an HTML File to Show the Chart
Navigate to the project navigator sidebar in Xcode project, and create an empty HTML file as chart.html.
In the HTML file, include a chart instance that will render the chart in our app inside WKWebView, which we will learn to create later. First, we will include the core packages in our HTML file and then create a chart instance.
Include the FusionCharts Core Package JS Files
Given below is the code to include the FusionCharts core package JS files (fusioncharts.js and fusioncharts.charts.js) in the HTML code:
<html>
<head>
<!-- including FusionCharts core package JS files →
<script src="fusioncharts.js"></script>
<script src="fusioncharts.widgets.js"></script>
</head>
</html>
Note: Please copy the files downloaded to the project folder. Ensure that the path specified in chart.html for FusionCharts core package JS files is accessible to the application. Also include these files in Build Phases -> Copy Bundle Resources.
Create Chart Instance
Chart instances include parameters like chart type, dimensions, chart container ID, data format, and data source for the chart which is used to render the chart. Given below is the code for creating the chart instance:
<!-- chart instance -->
<script>
FusionCharts.ready(function() {
var appChart = new FusionCharts({
type: 'doughnut2d',
width: '100%',
height: '350',
renderAt: 'chartContainer',
dataFormat: 'json',
dataSource: {
"chart": {
"caption": "New vs Retruning Users - 2017",
"captionFontSize": "17",
"captionFontBold": "0",
"subCaption": "ACME Inc.",
"subCaptionFontSize": "15",
"paletteColors": "#D68554, #DC4D52",
"bgColor": "#212831",
"canvasBgColor": "#212831",
"bgAlpha": "100",
"canvasBgAlpha": "0",
"showBorder": "0",
"showLabels": "0",
"showLegend": "1",
"legendBorderAlpha": "0",
"legendShadow": "0",
"use3DLighting": "0",
"showShadow": "0",
"drawCustomLegendIcon": "1",
"pieRadius": "100",
"doughnutRadius": "60",
"showPercentValues": "1",
"legendIconSides": "2",
"legendIconBorderThickness": "0",
"baseFont": "Source Sans Pro",
"defaultCenterLabel": "Total Visitors: 1.39M",
"centerLabel": "$label Visitors: $value",
"centerLabelBold": "0",
"baseFontSize": "13",
"startingAngle": "70",
"enableSlicing": "0",
"legendBgAlpha": "0",
"baseFontColor": "#FFFFFF",
"showTooltip": "0",
"showPlotBorder": "0"
},
"data": [
{
                                "label": "Returning",
                                "value": "862736.82"
                            },
                            {
                                "label": "New",
                                "value": "528774.18"
                            }
                        ]
}
}).render();
});
</script>
Given below is the complete HTML code of chart.html:
<!doctype html>
<html>
    <head>
        <title>FusionCharts - iOS Example</title>
        <meta name="viewport" content="width=device-width, initial-scale=1">
        <!-- including FusionCharts core package JS files -->
        <script src="fusioncharts.js"></script>
        <script src="fusioncharts.charts.js"></script>
        <style>
@import url('https://fonts.googleapis.com/css?family=Source+Sans+Pro');

            body { background-color: #212831; }
        </style>
        <!-- chart instance -->
        <script>
            FusionCharts.ready(function() {
               var appChart = new FusionCharts({
                   type: 'doughnut2d',
                   width: '100%',
                   height: '350',
                   renderAt: 'chartContainer',
                   dataFormat: 'json',
                   dataSource: {
                       "chart": {
                           "caption": "New vs Retruning Users - 2017",
                           "captionFontSize": "17",
                           "captionFontBold": "0",
                           "subCaption": "ACME Inc.",
                           "subCaptionFontSize": "15",
                           "paletteColors": "#D68554, #DC4D52",
                           "bgColor": "#212831",
                           "canvasBgColor": "#212831",
                           "bgAlpha": "100",
                           "canvasBgAlpha": "0",
                           "showBorder": "0",
                           "showLabels": "0",
                           "showLegend": "1",
                           "legendBorderAlpha": "0",
                           "legendShadow": "0",
                           "use3DLighting": "0",
                           "showShadow": "0",
                           "drawCustomLegendIcon": "1",
                           "pieRadius": "100",
                           "doughnutRadius": "60",
                           "showPercentValues": "1",
                           "legendIconSides": "2",
                           "legendIconBorderThickness": "0",
                           "baseFont": "Source Sans Pro",
                           "defaultCenterLabel": "Total Visitors: 1.39M",
                           "centerLabel": "$label Visitors: $value",
                           "centerLabelBold": "0",
                           "baseFontSize": "13",
                           "startingAngle": "70",
                           "enableSlicing": "0",
                           "legendBgAlpha": "0",
                           "baseFontColor": "#FFFFFF",
                           "showTooltip": "0",
                           "showPlotBorder": "0"
                       },
                       "data": [
                            {
                                "label": "Returning",
                                "value": "862736.82"
                            },
                            {
                                "label": "New",
                                "value": "528774.18"
                            }
                        ]
                   }
               }).render();
           });
        </script>
    </head>
    <body>
        <!-- chart container -->
        <div id="chartContainer">Chart will render here!</div>
    </body>
</html>
Step 3: Import WebKit and Create WKWebView
Now that you have the chart instance ready, let’s move on to view the application and create a webview that will render the HTML file.
To use WebKit, import it by running the following command at the top of ViewController.swift:
import WebKit
While creating the web view, store it as a property for later reference. Add the property of web view to ViewController class. Refer to the following command:
var webView: WKWebView!
Now, we will add loadView( ) before viewDidLoad(). Refer to the following command:
override func loadView() {
let webConfiguration = WKWebViewConfiguration()
webView = WKWebView(frame: .zero, configuration: webConfiguration)
webView.uiDelegate = self
view = webView
}
Include override keyword for loadView() to load the layout from the storyboard.
To load the chart in webView, insert the code given below to refer the HTML file (chart.html) created in the viewDidLoad() method:
let webView = WKWebView()
let htmlPath = Bundle.main.path(forResource: "charts", ofType: "html")
let htmlUrl = URL(fileURLWithPath: htmlPath!, isDirectory: false)
webView.loadFileURL(htmlUrl, allowingReadAccessTo: htmlUrl)
view = webView
Given below is the complete code for webView( ):
import UIKit
import WebKit

class ViewController: UIViewController, WKUIDelegate {

var webView: WKWebView!

override func loadView() {
let webConfiguration = WKWebViewConfiguration()
webView = WKWebView(frame: .zero, configuration: webConfiguration)
webView.uiDelegate = self
view = webView
    }

override func viewDidLoad() {
super.viewDidLoad()

let webView = WKWebView()
let htmlPath = Bundle.main.path(forResource: "charts", ofType: "html")
let htmlUrl = URL(fileURLWithPath: htmlPath!, isDirectory: false)
webView.loadFileURL(htmlUrl, allowingReadAccessTo: htmlUrl)
view = webView
}

override func didReceiveMemoryWarning() {
super.didReceiveMemoryWarning()
// Dispose of any resources that can be recreated.
}

}
Step 4: Build Project and Render the Chart (Simulator)
The final chart looks like as shown in the image below:
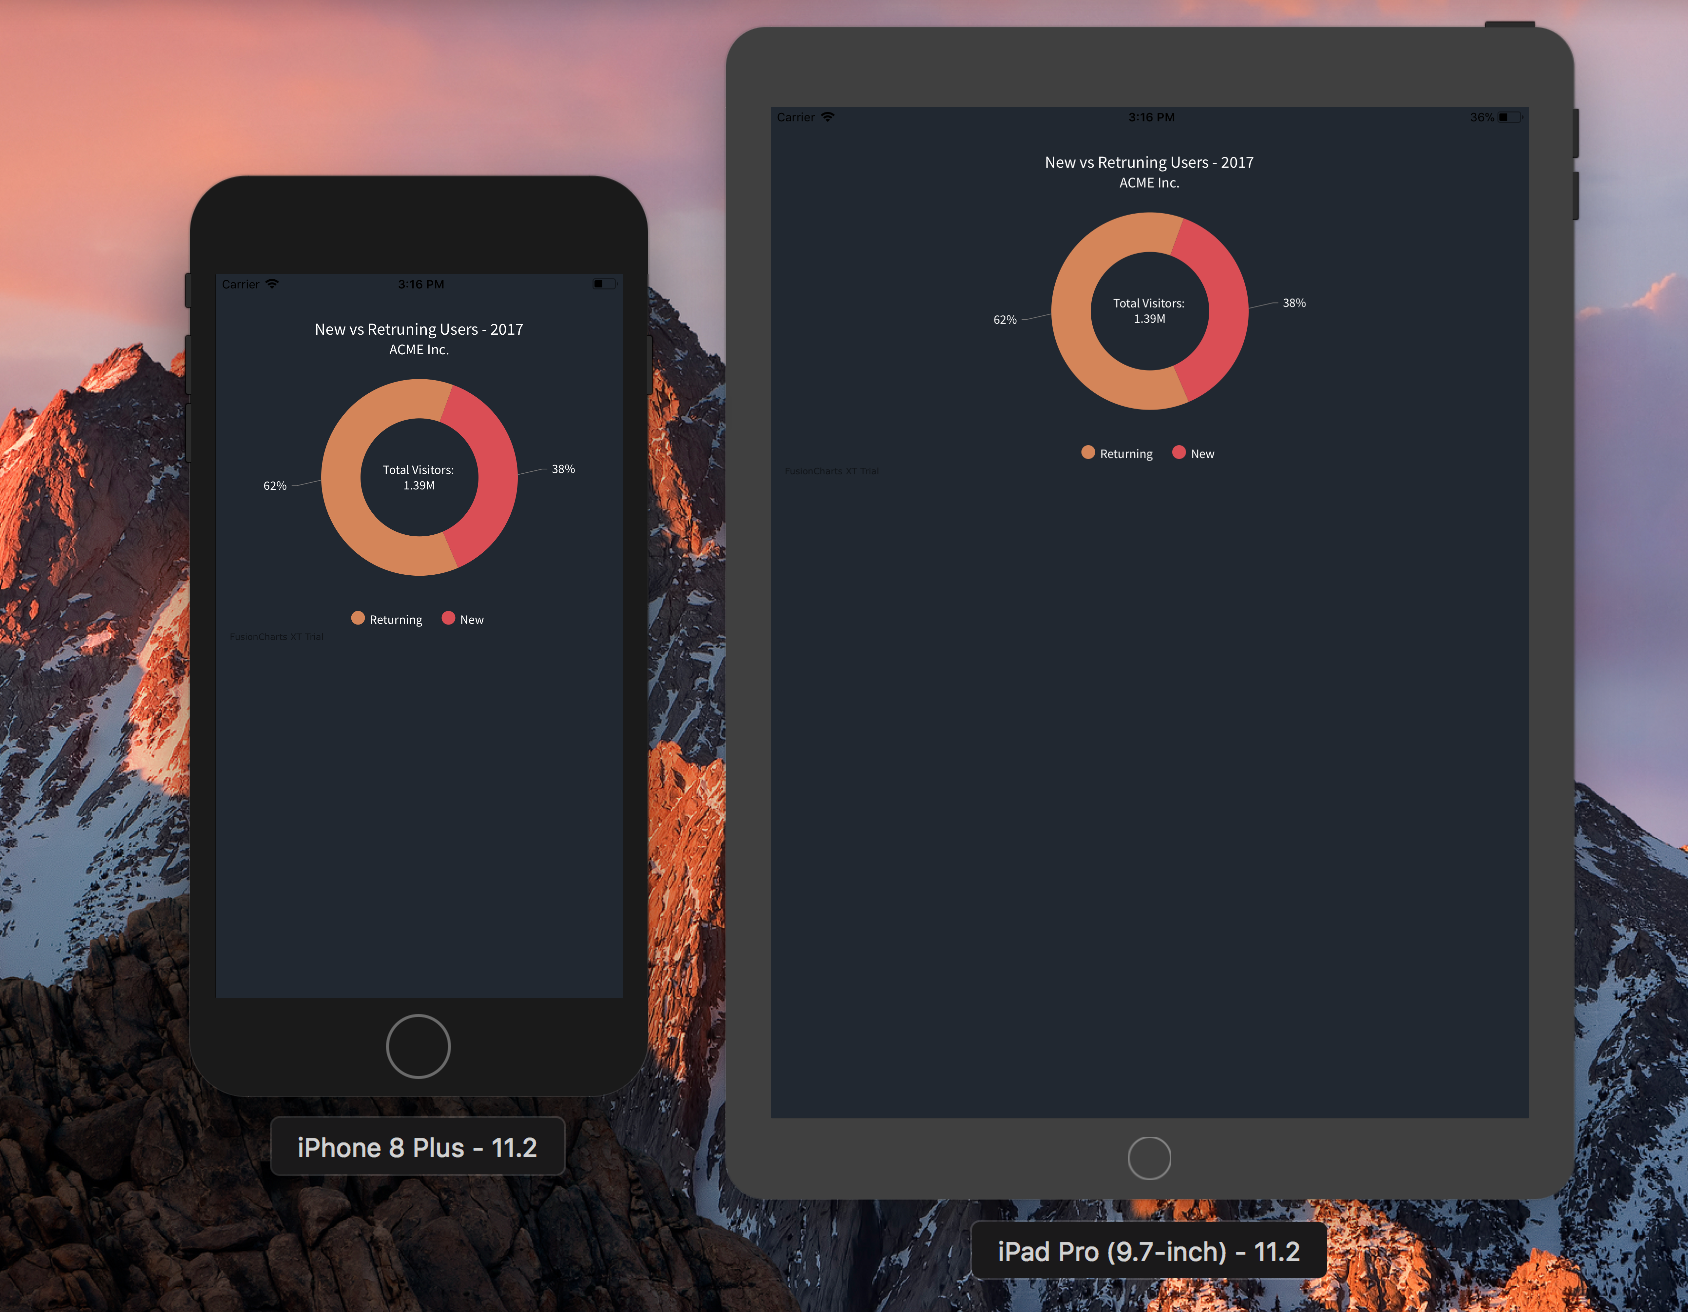
If you have a developer mode apple device, you can also check out the output on your device. You can download the source code from the GitHub repo.


Joel Sene
April 23, 2018, 8:39 pmAwesome tutorial and library. I`ve been using it for a school project where I have to show a Bar Chart and a Spreadsheet like report, where it explains the data shown in the Chart.
But I`ve been having some trouble to show the webView inside a containerView and not as the whole view.
Could you help me with that?
Jonathan
May 7, 2018, 1:06 pmDefinitely Joel. Please drop an email to [email protected] mentioning the issue you are facing. We’ll try our best to make it work for you.
Thanks.