PHP is one of the most widely used server side languages. We’ve already got detailed documentation on how PHP can be easily integrated with FusionCharts using the FusionCharts-PHP wrapper. We also had a recent blog post on how you can use the Zend Framework (a cluster of PHP packages) with FusionCharts.
PHP is fairly easy to work with, w.r.t its support for many database technologies. However, there is some work involved when using PHP with a NoSQL database.
However, before we move to talking about that, it is important that we brush up on what is NoSQL, for there will be many of us who aren’t familiar with this database technology.
Let’s first talk about:
Here goes the answers…
NoSQL also referred to as ‘NOT ONLY SQL’ or ‘non relational’ database, provides a data storage and retrieval mechanism that is modeled differently from the traditional tabular relations that are used in relational databases. NoSQL is used because it encompasses a wide variety of different database technologies that were developed in response to the demands presented in building modern applications. Top NoSQL databases used today include MongoDB, Redis, Cassandra, CouchDB HBase, Neo4j, and so on.
In this blog post, we’ll explore how to integrate PHP with MongoDB and create a chart using FusionCharts. MongoDB is an open-source, document-oriented database developed by MongoDB Inc. It works on the concept of document and collections, stores data in the JSON format, and can vary in structure as per the requirement. Query access is fast through the MongoDB Query Language. It uses dynamic schemas, meaning that you can create records without first defining the structure, such as the fields or the type of values.
Table of Contents
To get the code in this blog working, we need to install the following components:
Make sure that all the above mentioned components are present in the system and are working as expected.
Step 1: Execute the command “mongod” using the shell to run the mongodb server.
Step 2: Create a json file that contains the data that goes into the database and will used as the source data for the chart. We’ll name this file as fuel_price.json.
[
  {
    "month": "Jan", "petrol" : 64.72, "diesel": 52.49
  },
  {
    "month": "Feb", "petrol" : 62.81, "diesel": 50.72
  },
  {
    "month": "Mar", "petrol" : 66.18, "diesel": 54.06
  },
  {
    "month": "Apr", "petrol" : 65.17, "diesel": 51.74
  },
  {
    "month": "May", "petrol" : 72.94, "diesel": 57.23
  },
  {
    "month": "Jun", "petrol" : 73.77, "diesel": 55.83
  },
  {
    "month": "Jul", "petrol" : 70.7, "diesel": 52.59
  },
  {
    "month": "Aug", "petrol" : 66.72, "diesel": 47.54
  },
  {
    "month": "Sept", "petrol" : 64.61, "diesel": 47.02
  }
]
Step 3: Import the .json file created in Step 2 into mongodb using the command shown below.
Step 4: Next, open another shell to run the command “mongo”.
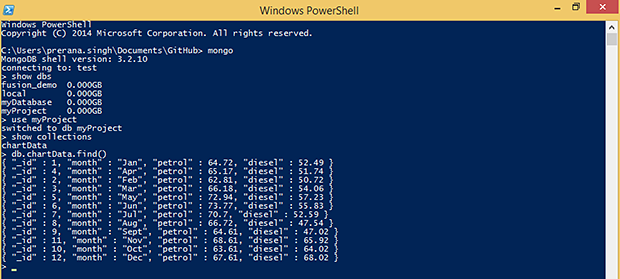
Now we need to verify if our data has been imported correctly into the database or no. To do this, you need to execute the following commands:
With this, we are done with creating the database.
Now lets move to the coding part that is a three-step process with, multiple sub-steps.
Create a file and save it as config.php inside the project folder.
require 'vendor\autoload.php';
$connection = new MongoDB\Client;
After completion of the configuration, the php code will look like this.
require 'config.php';
include("fusioncharts/fusioncharts.php") <hepad>
<script src="fusioncharts/fusioncharts.js"></script>
<script src="fusioncharts/fusioncharts.theme.fint.js"></script>
</hepad> myProject; $myObj = $db->chartData->find(); ?>
Here chartData is the collection name in the database myProject.
//convert mongoCursor into an array
    $data=iterator_to_array($myObj);
Thereafter, sort the associative array in an ascending order (if required).
asort($data);
$categoryArray=array();
            $dataseries1=array();
            $dataseries2=array();
            foreach ($data as $dataset) {
                    array_push($categoryArray, array(
                      "label" => $dataset["month"]
                    )
                );
                array_push($dataseries1, array(
                    "value" => $dataset["petrol"]
                    )
                );
                array_push($dataseries2, array(
                    "value" => $dataset["diesel"]
                    )
                );
            }
$arrData = array(
            "chart" => array(
                "caption"=> "Comparison of Petrol and Diesel price",
                "xAxisname"=> "Month",
                "yAxisName"=> "Price",
                "plotFillAlpha"=> "80",
                "showValues"=> "0",
                "bgcolor"=>"#89C3C4",
                "canvasbgcolor"=>"#A0CBC2",
                "paletteColors"=> "#00B1C1,#0184B8",
                "baseFont"=> "Open Sans",
                "showPlotBorder"=>"1",
                "theme" => "fint"
                )
            );
            $arrData["categories"]=array(array("category"=>$categoryArray));
                    // creating dataset object
$arrData["dataset"] = array(array("seriesName"=> "Petrol_price", "data"=>$dataseries1), array("seriesName"=> "Diesel_price", "renderAs"=>"line", "data"=>$dataseries2)); $jsonEncodedData = json_encode($arrData);
$msChart = new FusionCharts("msline","chart1" , "100%", "400", "chart-container", "json", $jsonEncodedData);

$msChart->render(); <div id="chart-container">Fusion Charts will render here</div>
Your output should be like the image shown below:
If you see any errors in your code, click here to download the complete source code of the sample project we have created for this tutorial.
Quick Answer To integrate interactive Vue charts into a Vue 3 application, first create a…
If you're looking for the best Vue chart library for interactive data visualization, there isn't…
Modern web applications generate and display more data than ever. They create from business dashboards…
Businesses collect data from multiple sources every day, including sales platforms, marketing tools, customer support…
Businesses generate more data than ever, from sales and marketing metrics to customer behavior and…
Choosing the right React chart library can be challenging. Some libraries are built for simple…