Table of Contents
<script type="text/javascript" src="fetch.js"></script>
<script type="text/javascript" src="https://unpkg.com/vue@2.3.3"></script>
<script type="text/javascript" src="https://unpkg.com/fusioncharts/fusioncharts.js"></script>
<script type="text/javascript" src="https://unpkg.com/fusioncharts/fusioncharts.charts.js"></script>
<script type="text/javascript" src="https://unpkg.com/fusioncharts@3.12.1/themes/fusioncharts.theme.fint.js"></script>
<script type="text/javascript" src="https://unpkg.com/fusioncharts@3.12.1/themes/fusioncharts.theme.ocean.js"></script>
<script type="text/javascript" src="https://unpkg.com/vue-fusioncharts/dist/vue-fusioncharts.min.js"></script>
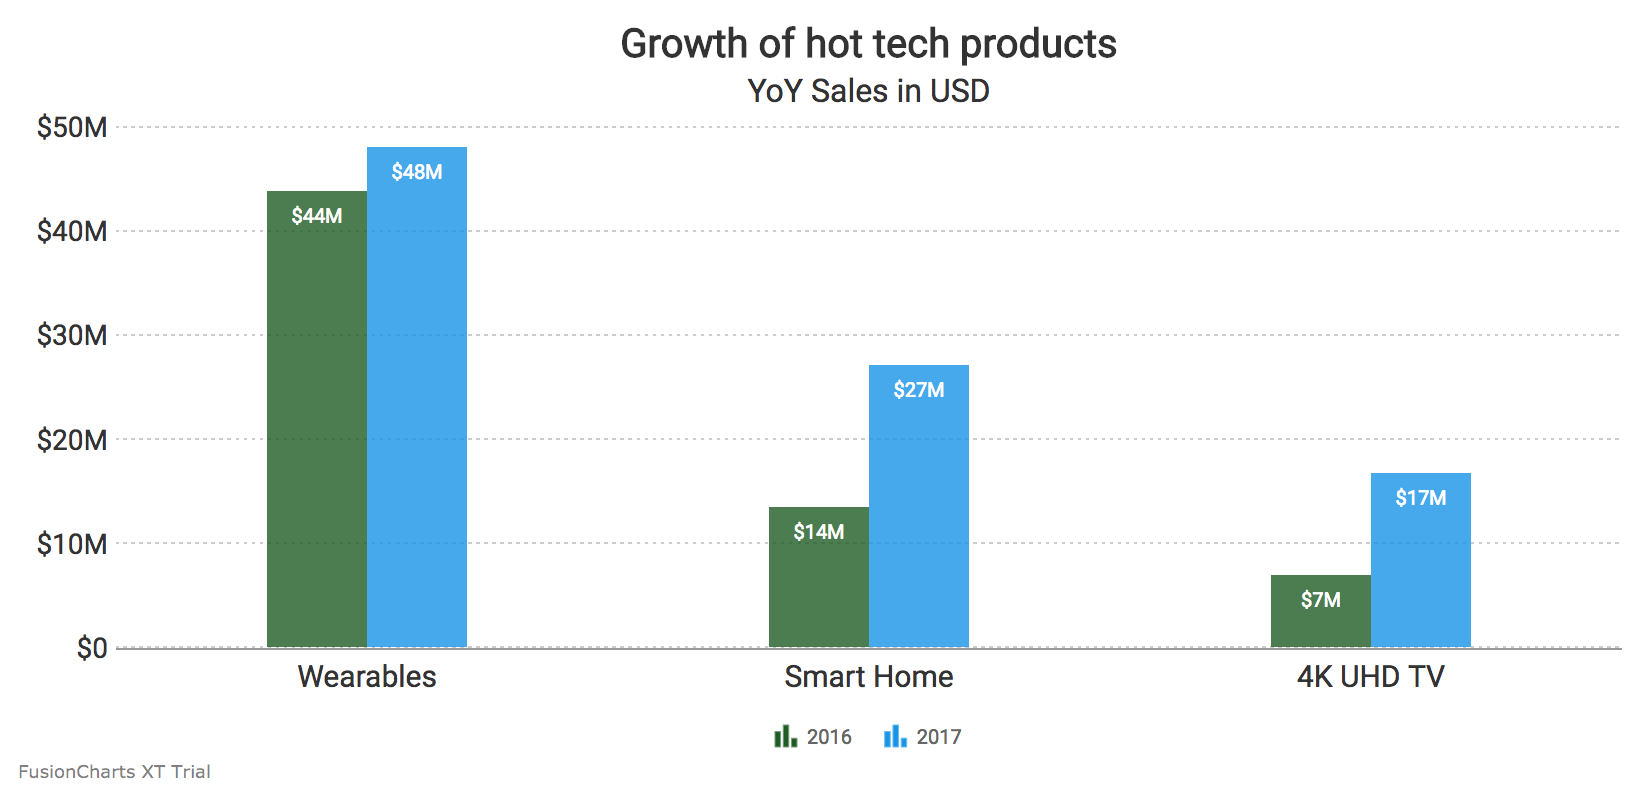
{
         "chart": {
           "caption": "Growth of hot tech products",
           "subcaption": "YoY Sales in USD",
           "decimals": "0",
           "numberprefix": "$",
           "baseFont": "Roboto",
           "baseFontSize": "14",
           "showAlternateVGridColor": "1",
           "alternateVGridAlpha": "5",
           "labelFontSize": "15",
           "captionFontSize": "20",
           "subCaptionFontSize": "16",
           "placevaluesinside": "1",
           "rotatevalues": "0",
           "divlinealpha": "50",
           "paletteColors": "#1B5E20, #0091EA",
           "plotfillalpha": "80",
           "drawCrossLine": "1",
           "crossLineColor": "#dddddd",
           "crossLineAlpha": "30",
           "theme": "ocean"
          },
         "categories": [{
           "category": [{
               "label": "Wearables"
             },
             {
               "label": "Smart Home"
             },
             {
               "label": "4K UHD TV"
             }
           ]
         }],
         "dataset": [{
             "seriesname": "2016",
             "data": [{
                 "value": "43680000"
               },
               {
                 "value": "13500000"
               },
               {
                 "value": "6847000"
               }
             ]
           }, {
             "seriesname": "2017",
             "data": [{
                 "value": "48000000"
               },
               {
                 "value": "27000000"
               },
               {
                 "value": "16700000"
               }
             ]
           }
         ]
       }
Setting the chart configuration To set the chart configuration, copy the following code and paste it in your JS file: window.loadApp = function (data) {
Vue.use(VueFusionCharts);
const app = new Vue({
el: '#app',
data: {
type: 'mscolumn2d',
width: '100%',
height: '400',
dataFormat: 'json',
dataSource: data
}
});
};
Rendering the chart Rendering the chart by calling the function Finally, to render the chart, paste the following code in your JS file: <div id="app">
<fusioncharts
:type="type"
:width="width"
:height="height"
:dataFormat="dataFormat"
:dataSource="dataSource"
></fusioncharts>
</div>
Here’s what we get as output: If you’ve followed the above steps correctly, your output should look like the image shown below: To create pie charts and generate statistical data, you’ll find this list of the best…
To implement FusionCharts in a dynamically resizing flexbox layout, ensure that the chart's dimensions are…
At FusionCharts, we believe in empowering developers and businesses with cutting-edge data visualization tools that…
Ever had a data set that seemed more complicated than a Rubik's cube? You’re not…
We’ve all seen them in textbooks or presentations—those overlapping circles that simplify complex information into…
We’re excited to announce the upcoming release of FusionCharts v4.1—a groundbreaking step forward in the…
View Comments