Vue.JS a progressive JavaScript-based framework works well when you want to build user interfaces. The Vue framework is designed such that it can be adopted incrementally; a developer’s familiarity with HTML, CSS, and JavaScript, therefore, makes it all the more easy to start working with Vue. Additionally, the core library’s focus on the view layer only allows for easy integration with other libraries too.
Table of Contents
Benefits of Vue.JS over other libraries
While every library comes with its own set of advantages, Vue.JS, for specific metrics, is marginally better than most other libraries. Vue’s rise in popularity over libraries like React and Angular is attributed to factors like runtime performance, optimization with respect to component re-rendering, CSS management, and data binding.
For example, when it comes to runtime performance, this is how Vue.JS compares with React for the time taken for creating 1000 rows after a page is loaded:
- react-v16.1.0-keyed: 187 ± 4.3
vue-v2.5.3-keyed: 169 ± 3.6
(Figures according to the data collected by a 3rd party benchmark)
Similarly, when it comes to Angular, Vue demonstrates a better performance due to better optimization.
The Vue-FusionCharts Component
FusionCharts Suite XT is a JavaScript based charting library that comes with several basic and advanced configurations supported by its large number of charts and maps.
The Vue-FusionCharts component lets you easily include FusionCharts in your Vue projects and add interactive charts to your Vue applications.
Integrating Vue.JS with FusionCharts
Downloading the required components
Before we look at how you can create charts using Vue.JS, you need to:
Download FusionCharts Suite XT.
The FusionCharts Suite XT downloads as a zip package. To install the suite, all you need to do is unzip the files and copy them in your project folder. As simple as that!
Download the Vue-FusionCharts component.
The Vue-FusionCharts component also downloads as a zip file. Unzip this and copy the files into your project folder.
Integrating the FusionCharts extension with Vue.JS
To include the FusionCharts library and the Vue-FusionCharts component in your project, copy the following code and paste it into your JavaScript file:
<script type="text/javascript" src="fetch.js"></script>
<script type="text/javascript" src="https://unpkg.com/[email protected]"></script>
<script type="text/javascript" src="https://unpkg.com/fusioncharts/fusioncharts.js"></script>
<script type="text/javascript" src="https://unpkg.com/fusioncharts/fusioncharts.charts.js"></script>
<script type="text/javascript" src="https://unpkg.com/[email protected]/themes/fusioncharts.theme.fint.js"></script>
<script type="text/javascript" src="https://unpkg.com/[email protected]/themes/fusioncharts.theme.ocean.js"></script>
<script type="text/javascript" src="https://unpkg.com/vue-fusioncharts/dist/vue-fusioncharts.min.js"></script>
Creating the chart instance
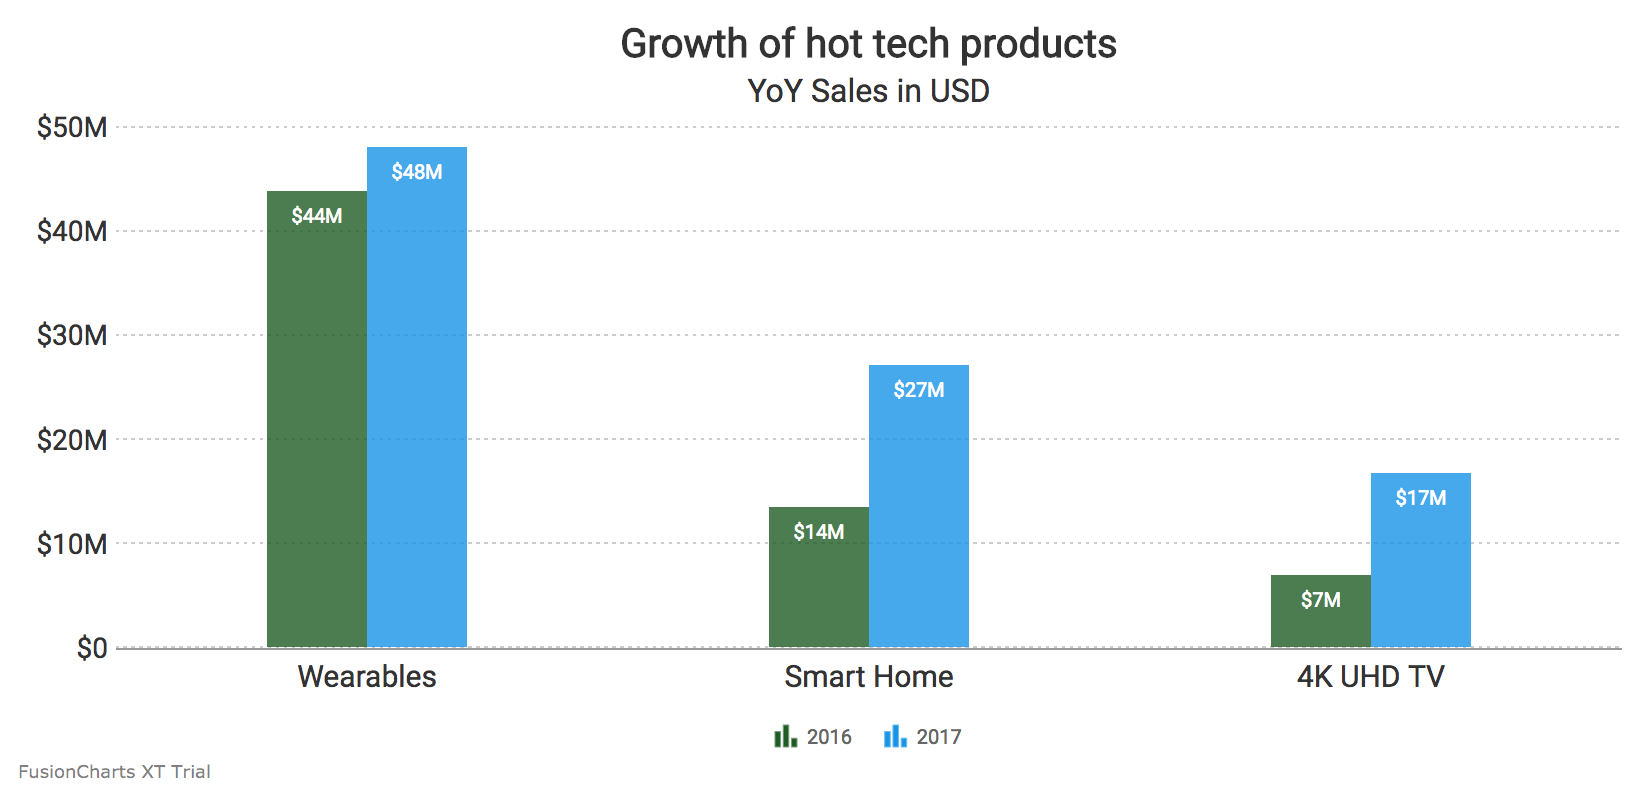
In this tutorial, we’ll create a multi-series column 2D chart that plots growth for the year over year sales of technology products.
Creating the data source
To create the data source for the sample chart, copy the code given below and paste it in your JS file:
{
         "chart": {
           "caption": "Growth of hot tech products",
           "subcaption": "YoY Sales in USD",
           "decimals": "0",
           "numberprefix": "$",
           "baseFont": "Roboto",
           "baseFontSize": "14",
           "showAlternateVGridColor": "1",
           "alternateVGridAlpha": "5",
           "labelFontSize": "15",
           "captionFontSize": "20",
           "subCaptionFontSize": "16",
           "placevaluesinside": "1",
           "rotatevalues": "0",
           "divlinealpha": "50",
           "paletteColors": "#1B5E20, #0091EA",
           "plotfillalpha": "80",
           "drawCrossLine": "1",
           "crossLineColor": "#dddddd",
           "crossLineAlpha": "30",
           "theme": "ocean"
          },
         "categories": [{
           "category": [{
               "label": "Wearables"
             },
             {
               "label": "Smart Home"
             },
             {
               "label": "4K UHD TV"
             }
           ]
         }],
         "dataset": [{
             "seriesname": "2016",
             "data": [{
                 "value": "43680000"
               },
               {
                 "value": "13500000"
               },
               {
                 "value": "6847000"
               }
             ]
           }, {
             "seriesname": "2017",
             "data": [{
                 "value": "48000000"
               },
               {
                 "value": "27000000"
               },
               {
                 "value": "16700000"
               }
             ]
           }
         ]
       }
Setting the chart configuration
To set the chart configuration, copy the following code and paste it in your JS file:
window.loadApp = function (data) {
 Vue.use(VueFusionCharts);

 const app = new Vue({
   el: '#app',
   data: {
     type: 'mscolumn2d',
     width: '100%',
     height: '400',
     dataFormat: 'json',
     dataSource: data
   }
 });
};
Rendering the chart
Rendering the chart by calling the function
Finally, to render the chart, paste the following code in your JS file:
<div id="app">
           <fusioncharts
           :type="type"
           :width="width"
           :height="height"
           :dataFormat="dataFormat"
           :dataSource="dataSource"
           ></fusioncharts>
       </div>
Here’s what we get as output:
If you’ve followed the above steps correctly, your output should look like the image shown below:
If you see any errors in your code or have trouble executing the above sample, click here for the complete source code. For more, refer to the FusionCharts Vue.JS component developer documentation.