Table of Contents
| Quarter | Marketing | Management | Operations |
|---|---|---|---|
| Q1 | 121000 | 190000 | 225000 |
| Q2 | 135000 | 195000 | 260000 |
| Q3 | 123500 | 187000 | 245000 |
| Q4 | 145000 | 190000 | 250000 |
import { NgModule } from '@angular/core';
import { BrowserModule } from '@angular/platform-browser';
// Import the library
import { FusionChartsModule } from 'angular2-fusioncharts';
import { AppComponent } from './app.component';

// Import angular2-fusioncharts
import { FusionChartsModule } from 'angular2-fusioncharts';

// Import FusionCharts library
import * as FusionCharts from 'fusioncharts';
// Import FusionCharts Charts module
import * as Charts from 'fusioncharts/fusioncharts.charts';

@NgModule({
  declarations: [
    AppComponent
  ],
  imports: [
    BrowserModule,
    // Specify FusionChartsModule as an import
    // and pass FusionCharts and Charts as a dependency
    // You can pass all other FusionCharts modules such as Charts, PowerCharts
    // Maps, Widgets e.t.c. after FusionCharts
    FusionChartsModule.forRoot(FusionCharts, Charts)
  ],
  bootstrap: [AppComponent]
})
export class AppModule { }
//our root app component
import {Component, NgModule} from '@angular/core'
import {BrowserModule} from '@angular/platform-browser'
@Component({
selector: 'my-app',
template: `<fusioncharts
width="100%"
height="450"
type="stackedcolumn2d"
dataFormat="json"
[dataSource]=dataSource >
</fusioncharts>
`,
})
export class App {
demoId: string;
constructor() {
this.demoId = "ex1";
this.dataSource = {
chart: {
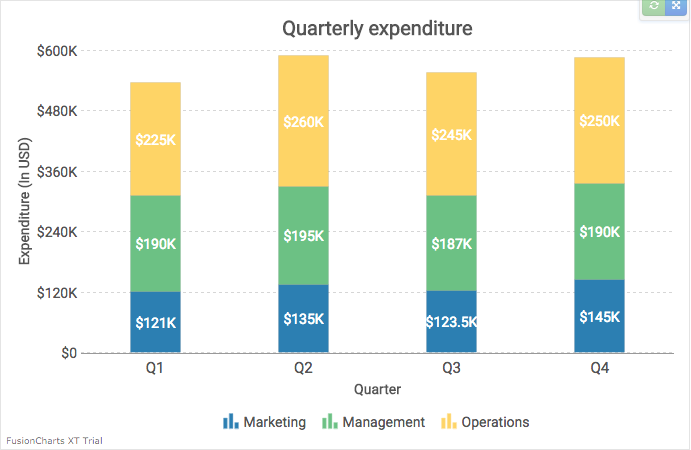
"caption": "Quarterly expenditure",
"xAxisname": "Quarter",
"yAxisName": "Expenditure (In USD)",
"numberPrefix": "$",
"baseFont": "Roboto",
"baseFontSize": "14",
"labelFontSize": "15",
"captionFontSize": "20",
"subCaptionFontSize": "16",
"paletteColors": "#2c7fb2,#6cc184,#fed466",
"bgColor": "#ffffff",
"legendShadow": "0",
"valueFontColor": "#ffffff",
"showXAxisLine": "1",
"xAxisLineColor": "#999999",
"divlineColor": "#999999",
"divLineIsDashed": "1",
"showAlternateHGridColor": "0",
"subcaptionFontBold": "0",
"subcaptionFontSize": "14",
"showHoverEffect": "1"
},
"categories": [{
"category": [{
"label": "Q1"
}, {
"label": "Q2"
}, {
"label": "Q3"
}, {
"label": "Q4"
}]
}],
"dataset": [{
"seriesname": "Marketing",
"data": [{
"value": "121000"
}, {
"value": "135000"
}, {
"value": "123500"
}, {
"value": "145000"
}]
}, {
"seriesname": "Management",
"data": [{
"value": "190000"
}, {
"value": "195000"
}, {
"value": "187000"
}, {
"value": "190000"
}]
}, {
"seriesname": "Operations",
"data": [{
"value": "225000"
}, {
"value": "260000"
}, {
"value": "245000"
}, {
"value": "250000"
}]
}]
};
}
}
The component adds the <fusioncharts> directive in the Angular app. The detailed chart configurations, along with the data in JSON format, are added to the component. <html>
<head>
<base href="." />
<title>Angular2 playground - FusionCharts</title>
<link rel="stylesheet" href="style.css" />
<script src="https://unpkg.com/core-js@2.4.1/client/shim.min.js"></script>
<script src="https://unpkg.com/zone.js/dist/zone.js"></script>
<script src="https://unpkg.com/zone.js/dist/long-stack-trace-zone.js"></script>
<script src="https://unpkg.com/reflect-metadata@0.1.3/Reflect.js"></script>
<script src="https://unpkg.com/systemjs@0.19.31/dist/system.js"></script>
<script src="config.js"></script>
<link href="https://fonts.googleapis.com/css?family=Roboto" rel="stylesheet">
<script>
System.import('app')
.catch(console.error.bind(console));
</script>
</head>
<body>
<my-app>
<h1>Creating your Chart in Angular using <i>FusionCharts</i>!</h1>
</my-app>
</body>
</html>
We now make a call to the <my-app> component that we created in Angular. //main entry point
import {platformBrowserDynamic} from '@angular/platform-browser-dynamic';
import {AppModule} from './module';
platformBrowserDynamic().bootstrapModule(AppModule)
When the <my-app> component is referenced, the AppModule function will get triggered. This would then import the FusionChartsModule, thereby rendering the chart using the chart component that we created. If you have been following along, your output should look similar to the image shown below: To create pie charts and generate statistical data, you’ll find this list of the best…
To implement FusionCharts in a dynamically resizing flexbox layout, ensure that the chart's dimensions are…
At FusionCharts, we believe in empowering developers and businesses with cutting-edge data visualization tools that…
Ever had a data set that seemed more complicated than a Rubik's cube? You’re not…
We’ve all seen them in textbooks or presentations—those overlapping circles that simplify complex information into…
We’re excited to announce the upcoming release of FusionCharts v4.1—a groundbreaking step forward in the…
View Comments
"AngularJS (version 1.x) when launched by Google a few years back"... Not true...
They took over the team and essentially taking over the project. They did not launch it...
Hey Robert, it would be more apt to say that AngularJS was developed at Google. As a by-product of the Google Feedback Tool. Misko Hevery and Adam Abrons (the inventors of Angular), were part of this team when they developed Angular to simplify the development process. The framework has ever-since been maintained by Google.