When Google released AngularJS (version 1.x) a few years ago, it was a compelling JavaScript library. However, when Facebook launched the ReactJS library, the library experienced unexpected developer attrition. They completely redesigned the architecture to keep it from becoming obsolete. The framework was a Model-View-Whatever architecture to a component-based architecture conversion. To commemorate the redesign of the architecture, the framework was renamed Angular (for versions 2 and up).
Angular was made modular as part of its architecture redesign. This feature allows you to install individual modules, allowing you to avoid installing unnecessary modules. Angular, on the other hand, insists on using TypeScript to ensure type safety in the app.
When creating an Angular application, you can divide it into multiple components that can be nested or child components. Each Angular component is made up of three major components:
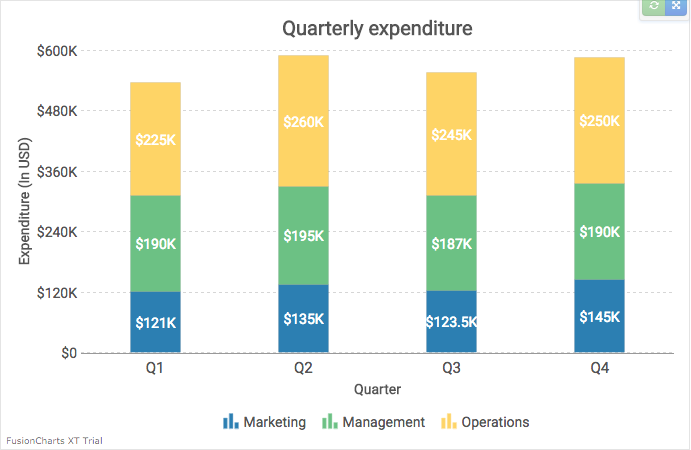
Since we are visualizing a part-to-whole data set, we will use a Stacked Column Chart.
 Alternatively, you can experiment with our codebase on Plunker.
If you still face issues with the implementation, you can reach out to us for support.
- Main file: contains the business logic of the app
- Index file: contains the user interface of the app
- App file: contains the core app configurations
Table of Contents
Step 1: Prepare the Data
The FusionCharts library currently accepts data in JSON and XML only. As such, we need to convert data in a format accepted by the library. For this AngularJS chart example, we will use JSON. We’ll use the following data that shows expenses incurred by different functions:| Quarter | Marketing | Management | Operations |
|---|---|---|---|
| Q1 | 121000 | 190000 | 225000 |
| Q2 | 135000 | 195000 | 260000 |
| Q3 | 123500 | 187000 | 245000 |
| Q4 | 145000 | 190000 | 250000 |
Step 2: Install the FusionCharts-Angular2 Extension
To get started, you need to install the FusionCharts-Angular2 Component using npm. `$ npm install angular2-fusioncharts –save` You then need to import the angular2-fusioncharts extension in the root @NgModuleimport { NgModule } from '@angular/core';
import { BrowserModule } from '@angular/platform-browser';
// Import the library
import { FusionChartsModule } from 'angular2-fusioncharts';
import { AppComponent } from './app.component';
// Import angular2-fusioncharts
import { FusionChartsModule } from 'angular2-fusioncharts';
// Import FusionCharts library
import * as FusionCharts from 'fusioncharts';
// Import FusionCharts Charts module
import * as Charts from 'fusioncharts/fusioncharts.charts';
@NgModule({
declarations: [
AppComponent
],
imports: [
BrowserModule,
// Specify FusionChartsModule as an import
// and pass FusionCharts and Charts as a dependency
// You can pass all other FusionCharts modules such as Charts, PowerCharts
// Maps, Widgets e.t.c. after FusionCharts
FusionChartsModule.forRoot(FusionCharts, Charts)
],
bootstrap: [AppComponent]
})
export class AppModule { }
Step 3: Create a Chart Component in Angular
Now we need to create the chart component.//our root app component
import {Component, NgModule} from '@angular/core'
import {BrowserModule} from '@angular/platform-browser'
@Component({
selector: 'my-app',
template: `<fusioncharts
width="100%"
height="450"
type="stackedcolumn2d"
dataFormat="json"
[dataSource]=dataSource >
</fusioncharts>
`,
})
export class App {
demoId: string;
constructor() {
this.demoId = "ex1";
this.dataSource = {
chart: {
"caption": "Quarterly expenditure",
"xAxisname": "Quarter",
"yAxisName": "Expenditure (In USD)",
"numberPrefix": "$",
"baseFont": "Roboto",
"baseFontSize": "14",
"labelFontSize": "15",
"captionFontSize": "20",
"subCaptionFontSize": "16",
"paletteColors": "#2c7fb2,#6cc184,#fed466",
"bgColor": "#ffffff",
"legendShadow": "0",
"valueFontColor": "#ffffff",
"showXAxisLine": "1",
"xAxisLineColor": "#999999",
"divlineColor": "#999999",
"divLineIsDashed": "1",
"showAlternateHGridColor": "0",
"subcaptionFontBold": "0",
"subcaptionFontSize": "14",
"showHoverEffect": "1"
},
"categories": [{
"category": [{
"label": "Q1"
}, {
"label": "Q2"
}, {
"label": "Q3"
}, {
"label": "Q4"
}]
}],
"dataset": [{
"seriesname": "Marketing",
"data": [{
"value": "121000"
}, {
"value": "135000"
}, {
"value": "123500"
}, {
"value": "145000"
}]
}, {
"seriesname": "Management",
"data": [{
"value": "190000"
}, {
"value": "195000"
}, {
"value": "187000"
}, {
"value": "190000"
}]
}, {
"seriesname": "Operations",
"data": [{
"value": "225000"
}, {
"value": "260000"
}, {
"value": "245000"
}, {
"value": "250000"
}]
}]
};
}
}
The component adds the <fusioncharts> directive in the Angular app. The detailed chart configurations, along with the data in JSON format, are added to the component.
Step 4: Render the Chart
<html>
<head>
  <base href="." />
  <title>Angular2 playground - FusionCharts</title>
  <link rel="stylesheet" href="style.css" />
  <script src="https://unpkg.com/[email protected]/client/shim.min.js"></script>
  <script src="https://unpkg.com/zone.js/dist/zone.js"></script>
  <script src="https://unpkg.com/zone.js/dist/long-stack-trace-zone.js"></script>
  <script src="https://unpkg.com/[email protected]/Reflect.js"></script>
  <script src="https://unpkg.com/[email protected]/dist/system.js"></script>
  <script src="config.js"></script>
  <link href="https://fonts.googleapis.com/css?family=Roboto" rel="stylesheet">
  <script>
    System.import('app')
      .catch(console.error.bind(console));
  </script>
</head>

<body>
  <my-app>
    <h1>Creating your Chart in Angular using <i>FusionCharts</i>!</h1>
  </my-app>
</body>
</html>
We now make a call to the <my-app> component that we created in Angular.
//main entry point
import {platformBrowserDynamic} from '@angular/platform-browser-dynamic';
import {AppModule} from './module';

platformBrowserDynamic().bootstrapModule(AppModule)
When the <my-app> component is referenced, the AppModule function will get triggered. This would then import the FusionChartsModule, thereby rendering the chart using the chart component that we created.
If you have been following along, your output should look similar to the image shown below:
 Alternatively, you can experiment with our codebase on Plunker.
If you still face issues with the implementation, you can reach out to us for support.


Robert
September 25, 2017, 1:25 pm“AngularJS (version 1.x) when launched by Google a few years back”… Not true…
They took over the team and essentially taking over the project. They did not launch it…
Jonathan
September 25, 2017, 7:52 pmHey Robert, it would be more apt to say that AngularJS was developed at Google. As a by-product of the Google Feedback Tool. Misko Hevery and Adam Abrons (the inventors of Angular), were part of this team when they developed Angular to simplify the development process. The framework has ever-since been maintained by Google.