Table of Contents
myproject directory in the current directory. django-admin startproject myproject You can use the cd command within the command-line interface to easily navigate to the required directory. myproject directory.static.index.html, in the template folder. This file will have the path to each javascript file and also the output element. <!DOCTYPE html>
<html>
<head>
<title>FC-python wrapper</title>
{% load static %}
<script type="text/javascript" src="{% static "fusioncharts/fusioncharts.js" %}"></script>
<script type="text/javascript" src="{% static "fusioncharts/themes/fusioncharts.theme.fint.js" %}"></script>
</head>
<body>
<div id="chart-1">{{ output|safe }}</div>
</body>
</html>
python manage.py collectstaticsettings.py file, update the location of the templates 'DIRS': ['fc_column2d/templates'],view.py file.from django.shortcuts import render
from django.http import HttpResponse
# Include the `fusioncharts.py` file which has required functions to embed the charts in html page
from .fusioncharts import FusionCharts
# Loading Data from a Static JSON String
# It is a example to show a Column 2D chart where data is passed as JSON string format.
# The `chart` method is defined to load chart data from an JSON string.
def chart(request):
# Create an object for the column2d chart using the FusionCharts class constructor
column2d = FusionCharts("column2d", "ex1" , "684", "476", "chart-1", "json",
# The data is passed as a string in the `dataSource` as parameter.
"""{
"chart": {
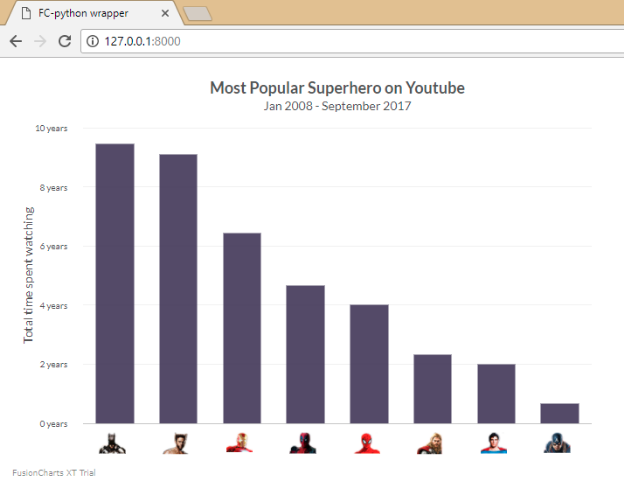
"caption": "Most Popular Superhero on Youtube",
"baseFont": "Lato",
"captionfontsize":"18",
"subcaptionfontbold":"0",
"subcaptionfontsize":"14",
"subcaption": "Jan 2008 - September 2017",
"yaxisname": "Total time spent watching",
"captionpadding": "20",
"bgalpha": "0",
"canvasbgalpha": "0",
"showvalues": "0",
"showborder": "0",
"canvasborderalpha": "0",
"showalternatehgridcolor": "0",
"plotgradientcolor": "",
"showplotborder": "0",
"adjustDiv":"0",
"yaxisnamefontsize":"14",
"yAxisNameFontBold":"0",
"yAxisValuesPadding":"18",
"divlinealpha": "10",
"xaxislinealpha":"20",
"LabelPadding": "50",
"showlabels": "0",
"numdivlines":"4",
"showxaxisline":"1",
"plotspacepercent":"40",
"yAxisValueDecimals":"0",
"formatnumberscale": "1",
"numberscalevalue": "24,31,12",
"numberscaleunit": " days, months, years",
"palettecolors": "#3F365A",
"plotToolText": "<div>Superhero : <b>$label</b><br/>Time Spend : <b>$value Hours</b></div>",
"defaultnumberscale": " years",
"plotFillAlpha": "90"
},
"annotations": {
"autoScale": "0",
"scaleImages": "0",
"origW": "400",
"origH": "300",
"groups": [{
"id": "user-images",
"items": [{
"id": "Batman-icon",
"type": "image",
"url": "https://csm.fusioncharts.com/files/assets/img/batman.png",
"x": "$dataset.0.set.0.CenterX - 18",
"y": "$dataset.0.set.0.EndY + 10",
"xScale": "75",
"yScale": "75"
}, {
"id": "Wolverine-icon",
"type": "image",
"url": "https://csm.fusioncharts.com/files/assets/img/wolverine.png",
"x": "$dataset.0.set.1.CenterX - 18",
"y": "$dataset.0.set.1.EndY + 10",
"xScale": "75",
"yScale": "75"
}, {
"id": "IronMan-icon",
"type": "image",
"url": "https://csm.fusioncharts.com/files/assets/img/ironman.png",
"x": "$dataset.0.set.2.CenterX - 18",
"y": "$dataset.0.set.2.EndY + 10",
"xScale": "75",
"yScale": "75"
}, {
"id": "Deadpool-icon",
"type": "image",
"url": "https://csm.fusioncharts.com/files/assets/img/deadpool.png",
"x": "$dataset.0.set.3.CenterX - 18",
"y": "$dataset.0.set.3.EndY + 10",
"xScale": "75",
"yScale": "75"
}, {
"id": "SpiderMan-icon",
"type": "image",
"url": "https://csm.fusioncharts.com/files/assets/img/spiderman.png",
"x": "$dataset.0.set.4.CenterX - 18",
"y": "$dataset.0.set.4.EndY + 10",
"xScale": "75",
"yScale": "75"
}, {
"id": "Thor-icon",
"type": "image",
"url": "https://csm.fusioncharts.com/files/assets/img/thor.png",
"x": "$dataset.0.set.5.CenterX - 18",
"y": "$dataset.0.set.5.EndY + 10",
"xScale": "75",
"yScale": "75"
}, {
"id": "SuperMan-icon",
"type": "image",
"url": "https://csm.fusioncharts.com/files/assets/img/superman.png",
"x": "$dataset.0.set.6.CenterX - 18",
"y": "$dataset.0.set.6.EndY + 10",
"xScale": "75",
"yScale": "75"
}, {
"id": "CaptainAmerica-icon",
"type": "image",
"url": "https://csm.fusioncharts.com/files/assets/img/captain-america.png",
"x": "$dataset.0.set.7.CenterX - 18",
"y": "$dataset.0.set.7.EndY + 10",
"xScale": "75",
"yScale": "75"
}]
}]
},
"data": [{
"label": "Batman",
"value": "85000"
}, {
"label": "Wolverine",
"value": "82000"
}, {
"label": "Iron Man",
"value": "58000"
}, {
"label": "Deadpool",
"value": "42000"
}, {
"label": "Spider Man",
"value": "36000"
}, {
"label": "Thor",
"value": "21000"
}, {
"label": "Super Man",
"value": "18000"
}, {
"label": "Captain A",
"value": "6000"
}]
}""")
# returning complete JavaScript and HTML code, which is used to generate chart in the browsers.
return render(request, 'index.html', {'output' : column2d.render()})
urls.py file, to automatically set the URL to render the chart. from django.conf.urls import url
from.import views
urlpatterns = [
url(r'^$', views.chart, name = 'demo'),
]
STATICFILES_DIRS object, include it in the settings.py file.STATICFILES_DIRS = [
os.path.join(BASE_DIR, "fc_column2d/templates/static"),
]
python manage.py runserverTo create pie charts and generate statistical data, you’ll find this list of the best…
To implement FusionCharts in a dynamically resizing flexbox layout, ensure that the chart's dimensions are…
At FusionCharts, we believe in empowering developers and businesses with cutting-edge data visualization tools that…
Ever had a data set that seemed more complicated than a Rubik's cube? You’re not…
We’ve all seen them in textbooks or presentations—those overlapping circles that simplify complex information into…
We’re excited to announce the upcoming release of FusionCharts v4.1—a groundbreaking step forward in the…