
Python was quickly becoming a popular programming language for creating web-based applications. The Django web framework was created to capitalize on this popularity and to enable the rapid deployment of secure and maintainable web applications.
Django, an open-source web framework built entirely in Python, employs the model-view-template (MVT) architectural pattern. This framework repurposes components designed to aid in rapid development. Because it is written in Python, this framework is very portable and can run on any platform. It also supports a number of client-side frameworks, templating engines, and databases.
In this post, we’ll go over how to make Live Charts with the Django framework, and we’ll use the FusionCharts JavaScript library to do so.
Table of Contents
Basic Requirements
You can create a chart in a web app developed using Django. You will need to download and install the following items into your system:
-
- Django Framework –
-
- FusionCharts Library –
-
- FusionCharts Django Wrapper –
Note: You will need to install Python to start using Django. You will also require a working knowledge of Python to be able to execute the code.
Creating Charts Using the Django Framework
Step 1: Creating the Project
Run the following command to create the myproject directory in the current directory.
django-admin startproject myproject
You can use the cd command within the command-line interface to easily navigate to the required directory.
Step 2: Adding the Dependencies
Next, we will add the FusionCharts JavaScript files required to render the charts in the web application.
- Create a template folder inside the
myprojectdirectory. - Inside the template folder, create another folder named
static. - Copy all the javascript files extracted from the FusionCharts library into this folder.
- To map the javascript files, create an HTML file,
index.html, in the template folder. This file will have the path to each javascript file and also the output element.<!DOCTYPE html> <html> <head> <title>FC-python wrapper</title> {% load static %} <script type="text/javascript" src="{% static "fusioncharts/fusioncharts.js" %}"></script> <script type="text/javascript" src="{% static "fusioncharts/themes/fusioncharts.theme.fint.js" %}"></script> </head> <body> <div id="chart-1">{{ output|safe }}</div> </body> </html> - After including the paths of all the dependencies required, we need to update the static files by running the following command
python manage.py collectstatic - In the
settings.pyfile, update the location of the templates
'DIRS': ['fc_column2d/templates'],
Step 3: Creating the View Page
The view page contains the chart constructors, attributes as well as the data source required to render the chart.
- Add the code given below to the
view.pyfile.
from django.shortcuts import render
from django.http import HttpResponse

# Include the `fusioncharts.py` file which has required functions to embed the charts in html page
from .fusioncharts import FusionCharts

# Loading Data from a Static JSON String
# It is a example to show a Column 2D chart where data is passed as JSON string format.
# The `chart` method is defined to load chart data from an JSON string.

def chart(request):
    # Create an object for the column2d chart using the FusionCharts class constructor
  column2d = FusionCharts("column2d", "ex1" , "684", "476", "chart-1", "json",
        # The data is passed as a string in the `dataSource` as parameter.
    """{
        "chart": {
        "caption": "Most Popular Superhero on Youtube",
        "baseFont": "Lato",
        "captionfontsize":"18",
        "subcaptionfontbold":"0",
        "subcaptionfontsize":"14",
        "subcaption": "Jan 2008 - September 2017",
        "yaxisname": "Total time spent watching",
        "captionpadding": "20",
        "bgalpha": "0",
        "canvasbgalpha": "0",
        "showvalues": "0",
        "showborder": "0",
        "canvasborderalpha": "0",
        "showalternatehgridcolor": "0",
        "plotgradientcolor": "",
        "showplotborder": "0",
        "adjustDiv":"0",
        "yaxisnamefontsize":"14",
        "yAxisNameFontBold":"0",
        "yAxisValuesPadding":"18",
        "divlinealpha": "10",
        "xaxislinealpha":"20",
        "LabelPadding": "50",
        "showlabels": "0",
        "numdivlines":"4",
        "showxaxisline":"1",
        "plotspacepercent":"40",
        "yAxisValueDecimals":"0",
        "formatnumberscale": "1",
        "numberscalevalue": "24,31,12",
        "numberscaleunit": " days, months, years",
        "palettecolors": "#3F365A",
        "plotToolText": "<div>Superhero : <b>$label</b><br/>Time Spend : <b>$value Hours</b></div>",
        "defaultnumberscale": " years",
        "plotFillAlpha": "90"
      },
      "annotations": {
        "autoScale": "0",
        "scaleImages": "0",
        "origW": "400",
        "origH": "300",
        "groups": [{
          "id": "user-images",
          "items": [{
            "id": "Batman-icon",
            "type": "image",
            "url": "https://csm.fusioncharts.com/files/assets/img/batman.png",
            "x": "$dataset.0.set.0.CenterX - 18",
            "y": "$dataset.0.set.0.EndY + 10",
            "xScale": "75",
            "yScale": "75"
          }, {
            "id": "Wolverine-icon",
            "type": "image",
            "url": "https://csm.fusioncharts.com/files/assets/img/wolverine.png",
            "x": "$dataset.0.set.1.CenterX - 18",
            "y": "$dataset.0.set.1.EndY + 10",
            "xScale": "75",
            "yScale": "75"
          }, {
            "id": "IronMan-icon",
            "type": "image",
            "url": "https://csm.fusioncharts.com/files/assets/img/ironman.png",
            "x": "$dataset.0.set.2.CenterX - 18",
            "y": "$dataset.0.set.2.EndY + 10",
            "xScale": "75",
            "yScale": "75"
          }, {
            "id": "Deadpool-icon",
            "type": "image",
            "url": "https://csm.fusioncharts.com/files/assets/img/deadpool.png",
            "x": "$dataset.0.set.3.CenterX - 18",
            "y": "$dataset.0.set.3.EndY + 10",
            "xScale": "75",
            "yScale": "75"
          }, {
            "id": "SpiderMan-icon",
            "type": "image",
            "url": "https://csm.fusioncharts.com/files/assets/img/spiderman.png",
            "x": "$dataset.0.set.4.CenterX - 18",
            "y": "$dataset.0.set.4.EndY + 10",
            "xScale": "75",
            "yScale": "75"
          }, {
            "id": "Thor-icon",
            "type": "image",
            "url": "https://csm.fusioncharts.com/files/assets/img/thor.png",
            "x": "$dataset.0.set.5.CenterX - 18",
            "y": "$dataset.0.set.5.EndY + 10",
            "xScale": "75",
            "yScale": "75"
          }, {
            "id": "SuperMan-icon",
            "type": "image",
            "url": "https://csm.fusioncharts.com/files/assets/img/superman.png",
            "x": "$dataset.0.set.6.CenterX - 18",
            "y": "$dataset.0.set.6.EndY + 10",
            "xScale": "75",
            "yScale": "75"
          }, {
            "id": "CaptainAmerica-icon",
            "type": "image",
            "url": "https://csm.fusioncharts.com/files/assets/img/captain-america.png",
            "x": "$dataset.0.set.7.CenterX - 18",
            "y": "$dataset.0.set.7.EndY + 10",
            "xScale": "75",
            "yScale": "75"
          }]
        }]
      },
      "data": [{
        "label": "Batman",
        "value": "85000"
      }, {
        "label": "Wolverine",
        "value": "82000"
      }, {
        "label": "Iron Man",
        "value": "58000"
      }, {
        "label": "Deadpool",
        "value": "42000"
      }, {
        "label": "Spider Man",
        "value": "36000"
      }, {
        "label": "Thor",
        "value": "21000"
      }, {
        "label": "Super Man",
        "value": "18000"
      }, {
        "label": "Captain A",
        "value": "6000"
      }]
      }""")

    # returning complete JavaScript and HTML code, which is used to generate chart in the browsers.
  return  render(request, 'index.html', {'output' : column2d.render()})
Step 4: Setting Up the Configuration File
- Add the following code snippet to the
urls.pyfile, to automatically set the URL to render the chart.from django.conf.urls import url from.import views urlpatterns = [ url(r'^$', views.chart, name = 'demo'), ] - To update the
STATICFILES_DIRSobject, include it in thesettings.pyfile.
STATICFILES_DIRS = [
    os.path.join(BASE_DIR, "fc_column2d/templates/static"),
]
Step 5: Rendering the Chart
With all the code in place, it is now time to render the chart.
- Run the following command on the shell interface
python manage.py runserver
If you’ve followed the steps closely, your output should like the chart shown in the image below:
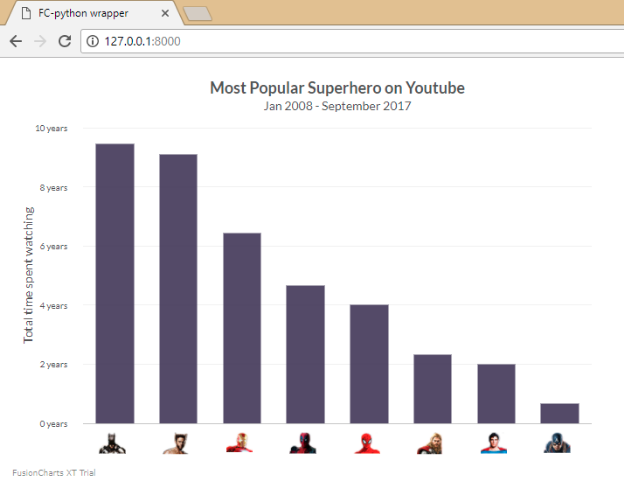
If you see any errors in your code, you can download the complete source code of the sample project we have created for this tutorial.
The article was first published here.