Create Interactive Charts with the FusionCharts jQuery Plugin
Getting Started with jQuery Charts
This quick demo will guide you through the simple steps to integrate FusionCharts into your web applications, allowing you to visualize data dynamically and impressively.Interactive examples and Code Snippets
FusionCharts’ jQuery Plugin Key Features and Benefit
Creating dynamic and interactive charts on web applications enhances data visualization. FusionCharts, a powerful JavaScript charting library, seamlessly integrates with jQuery to offer a robust solution for chart creation. By leveraging the combined capabilities of FusionCharts and jQuery, developers can easily generate visually compelling charts that dynamically respond to data changes. Here is a list of features that can help you understand more about jQuery charts feature:
jQuery Charts Features
- Helps in building beautiful data views that would satisfy the requirements of different types of businesses
- Seamless interaction and smooth responsiveness
- Can be used across various platforms and can be shared with the rest of the Wordpress community
- Boils down most of the common functions and practices into one plugin
- Makes the developer’s life easier by combining and simplifying critical syntax
Premium Features of jQuery Charts
- Zero down the conflict with the existing HTML, CSS, and JavaScript.
- jQuery charts come with multiple rendering options
- Updation of chart data, chart type, or chart size
- Quick updation of the chart’s root properties
- Replacement of content from the container with the help of a chart.
- Enables seamless interactivity among charts
Why Choose FusionCharts jQuery Plugin?
- Responsive across different devices
- Tested and created for millions of data points
- Open Source Platform
- Our jQuery charts are actively maintained by a team of dedicated developers
Features of the integration
Multiple data types
Insert charts from a JSON URL, an XML URL, or using Props Array Binding.
Add interactivity with ease
Enable interactivity between charts with hundreds of events and methods
Complete control over configurations
Enjoy advanced control with full access to FusionCharts object that contains complete chart configurations.
Build 100+ charts and 2000+ maps
Go beyond column charts and pie charts with our 100+ charts made for any kind of data. From area to donut and marimekko to radar, we’ve got all your charting needs covered. Don’t just stop at charts, with 2000+ maps, gauges and more, your dashboards and reports will become more meaningful and insightful.

Chart Gallery
Explore 100+ charts for your React application

Time Series Gallery
Explore how to plot millions of data on a time-series chart in React

Maps Gallery
Render 2000+ Maps for your React project


Dashboards built using jQuery
We have built over 20+ dashboards for various industries and use-cases. The best part of these dashboards? They are open source and completely free to use! Just download them and explore how you can use jQuery Charts for FusionCharts in the real-world.
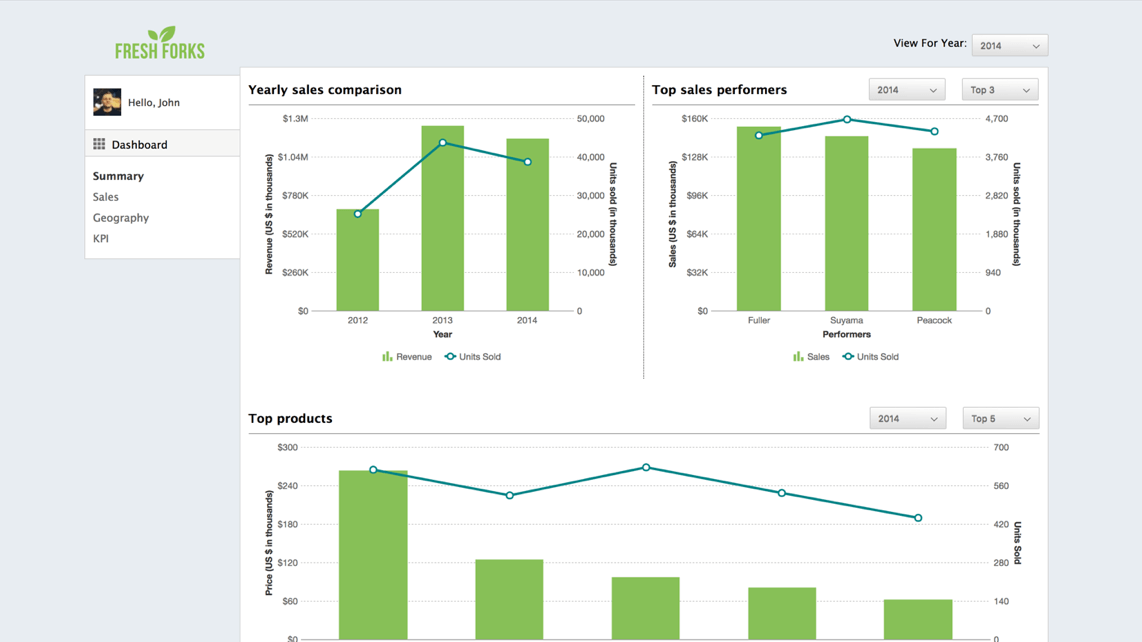
Sales Management Dashboard
Simplify sales admin functionalities with a centralized view of the location, people, product and inventory metrics.

Pediatrics Center Dashboard
See the performance of your pediatrics center in one view. Along with monitoring the key indicators - Admissions, Discharges, Patient LWOBS (Left Without Being Seen), LOS (Length of Stay).
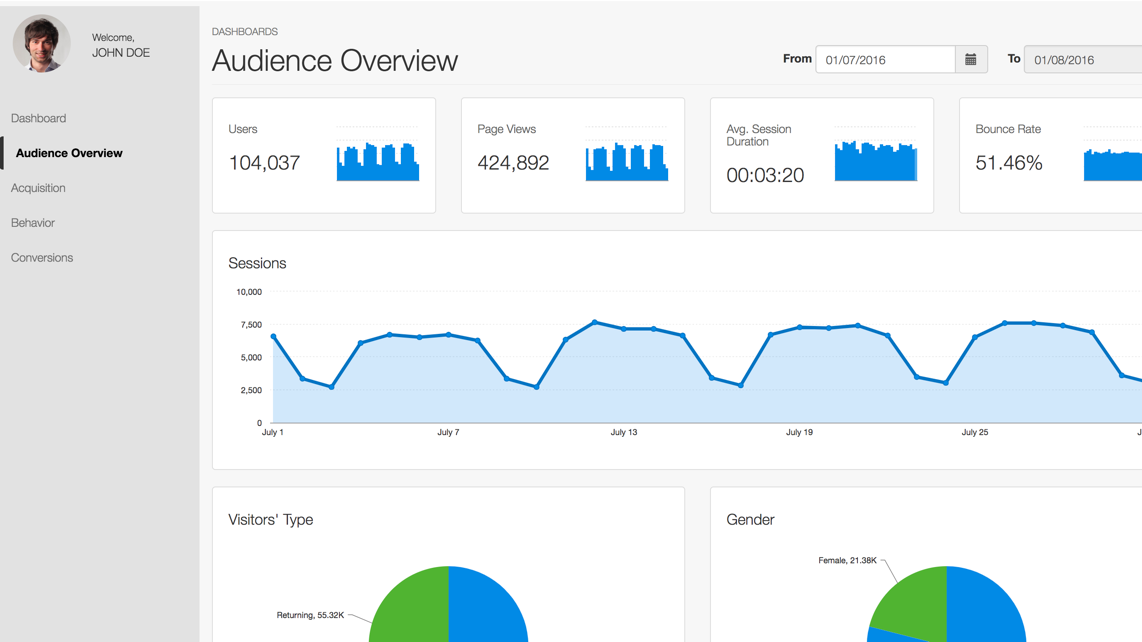
Google Analytics Web Dashboard
Monitor website traffic and stay informed about visitor demographics hassle-free, with our Google Analytics Dashboard.


Ready to Get Started?
Frequently Asked Questions
Can FusionCharts' jQuery Plugin be integrated with Bootstrap or jQuery UI?
Yes, FusionCharts' jQuery Plugin is compatible with both Bootstrap and jQuery UI, allowing seamless integration with these frameworks for creating responsive and interactive charts.Does FusionCharts' jQuery Plugin offer support for real-time updates and event handling?
Yes, the jQuery charts plugin supports real-time updates and event handling. Developers can dynamically update chart data, types, and sizes and add charts during runtime, enabling interactive and responsive charting experiences.
Is FusionCharts' jQuery Plugin suitable for handling large datasets?
Absolutely. FusionCharts' jQuery Plugin is designed and tested to handle millions of data points without compromising performance, ensuring smooth rendering and interaction even with extensive datasets.