Shipment Analysis Dashboard
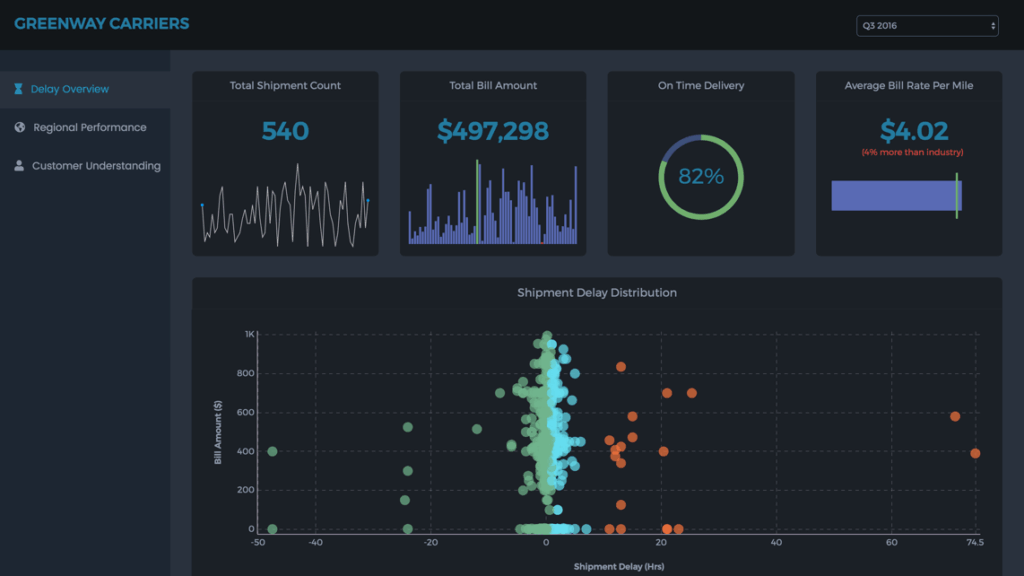
Make better decisions by getting a 360° view of your shipment performance. This dashboard can help you monitor, analyze and understand the monthly, quarterly, and semi-annual performance of a shipper. Using this dashboard, you can know the shipment performance across regions, get an overview of the shipment delay, and understand the important customers better.
Key features

Track shipment KPIs and compare them against the industry benchmark
Monitor business performance across different regions
Identify important customers by knowing their volume of shipment and avg. value of each shipment
Get a detailed understanding of delay in shipments
How to get started with this dashboard
Environment Setup
- Make sure you have Node JS >= 8.10 and npm >= 5.6 and Angular is installed on your machine
Project Files Setup
- Create a folder and extract the zip
- Navigate to the extracted folder in terminal
- Delete the file 'package-lock.json'
- Install the dependencies by running the following command
npm installornpm i - Go to
clientfolder and runnpm installornpm i - Install MongoDB Server
- Import the data to MongoDB by running the following command:
node data/insert-into-db.js - Open config.json in
client/srcfolder, changeCURR_MODEtolocal - To start server, run the following
npm run start - To start client, run the following, in
clientfoldernpm run start