Investment Portfolio Dashboard
Track and monitor your investments by different countries, asset classes and rating groups. This simple to use exploratory dashboard can give you a quick sense of the rate of return, investment distribution and portfolio risk associated with your investment choices. Trend of yearly investments, distribution of asset classes, and investment concentration in different countries are some key things which are readily available.Using the same data source and format, easily create your FusionGrid using FusionChart data.
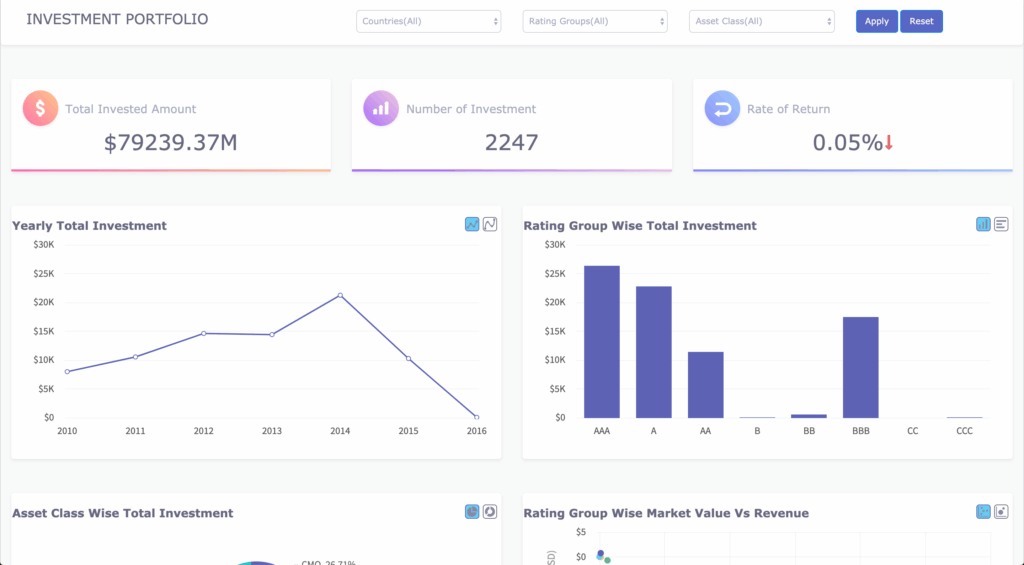

Monitor your investment amount, number of investments and rate of return.
Explore investments by countries, rating groups and asset classes.
Track the trend of yearly total investment.
Know the investment concentration by asset class or rating group.
See the distribution of asset class by profit and market value.
See and browse the detailed data with FusionGrid
FusionGrid shows data using the same data source as FusionCharts
How to get started with this dashboard
Environment Setup
- Make sure you have Node JS >= 8.10 and npm >= 5.6 and Angular is installed on your machine
Project Files Setup
- Create a folder and extract the zip
- Navigate to the extracted folder in terminal
- Install the dependencies by running the following command
npm installornpm i
Building and running the dashboard
- Launch the server using the follwing command -
npm start, orng serve --baseHref=/demos/dashboards/investment-portfolio/ - Open the browser and visit URL https://localhost:4200