Smart Energy Monitoring Dashboard
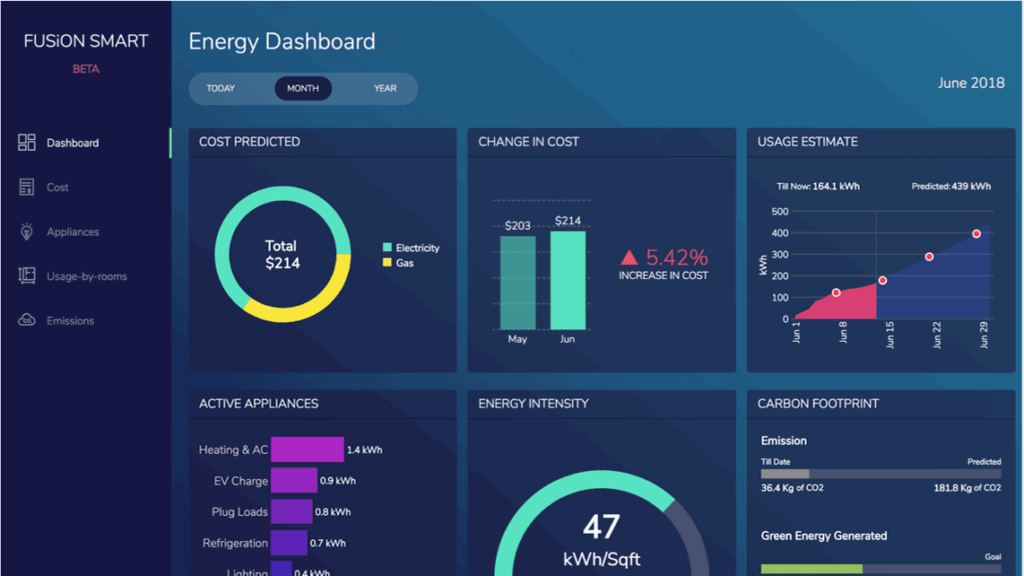
Improve visibility for energy consumption and costs with our Smart Dashboard.. Know exactly how much was spent on gas & electricity, which appliances are the primary power guzzlers, and what needs to change. Our simple, GUI-based interface makes consistent monitoring a breeze.
Key features

Identify inefficient rooms, which continue to consume power even when used sparingly
Gas or electricity? Know exactly how much power, from which source, was spent on ambient conditions maintenance
Anticipate next month’s bills with predictive estimates, right from the tooltip
Ensure emissions don’t exceed acceptable thresholds.
Metrics & KPIs to Include on Your Smart Energy Monitoring Dashboard
- Analyze energy consumption trends for informed decision-making and proactive energy management.
- Identify energy spikes and equipment issues promptly through real-time tracking.
- Energy cost analysis to make cost-saving decisions.
- Monitor carbon emissions to ensure sustainability and regulatory compliance using Carbon Emissions Tracking.
- Energy intensity measures for efficiency evaluation and improvement.
- Peak Demand Analysis monitors peak demand periods to cut expenses during peak hours.
- Monitors equipment performance to enhance energy efficiency and pinpoint maintenance requirements.
- Reduce energy waste during extreme weather to improve efficiency and promote sustainability.
How to get started with this dashboard
Environment Setup
- Make sure you have Node JS >= 8.10 and npm >= 5.6
Project Files Setup
- Create a folder and extract the zip
- Navigate to the extracted folder in terminal
- Run the following command to install the dependencies
npm installornpm i - Start the server using below command
npm run start - Open URL https://localhost:3000/ into browser