Happy New Year 2024! Wishing you a happy Year filled with success and exciting advancements on the horizon!
While our 2023 New Year’s resolutions may already be long abandoned, do you know what’s not getting left behind this year?
At FusionCharts, we understand that we’re on the doorstep of a new, massive wave of transformation, powered by artificial intelligence. Despite the recent advancements in modern AI, most software companies are still grappling with how best to seize this opportunity and implement it across their organizations. Those who struggle to adapt risk being left behind.
We’re just beginning to see the profound impact AI will have on how we work and live. According to Goldman Sachs, AI is projected to fuel a massive transformation in the economy, increasing annual global GDP by $7 trillion and lifting productivity growth by 1.5% over the next decade.
Let’s explore how software companies are racing to rethink their technology, teams, and processes to seize this opportunity!
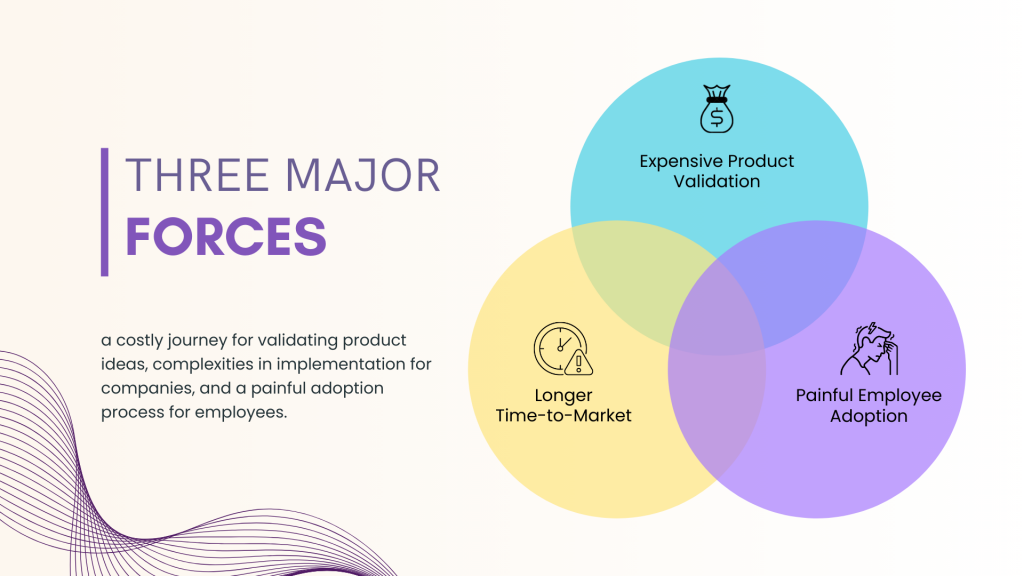
Even though Javascript charting libraries are a neat shortcut for data visualization, and are still commonly used by development teams of all sizes, very few of these libraries are equipped to help companies realize the potential of AI and keep up with the pace of change. On one hand, you still need developers to write and implement the visualizations in your app or website, and when you account for the time to implement them and the hourly wages for your developers, it translates into thousands of dollars in resources. On the other hand, it can take weeks and sometimes months to go from an idea to a finished product.
Three major forces: Expensive path to validating product ideas + difficult for companies to implement + and painful for employees to adopt.
The future of data visualization demands more flexibility than modern charting libraries can provide. To meet the evolving demands for flexibility in data visualization, JavaScript charting providers need to adapt and innovate. Let’s explore some key strategies and features they can implement to ensure they remain relevant in the future.
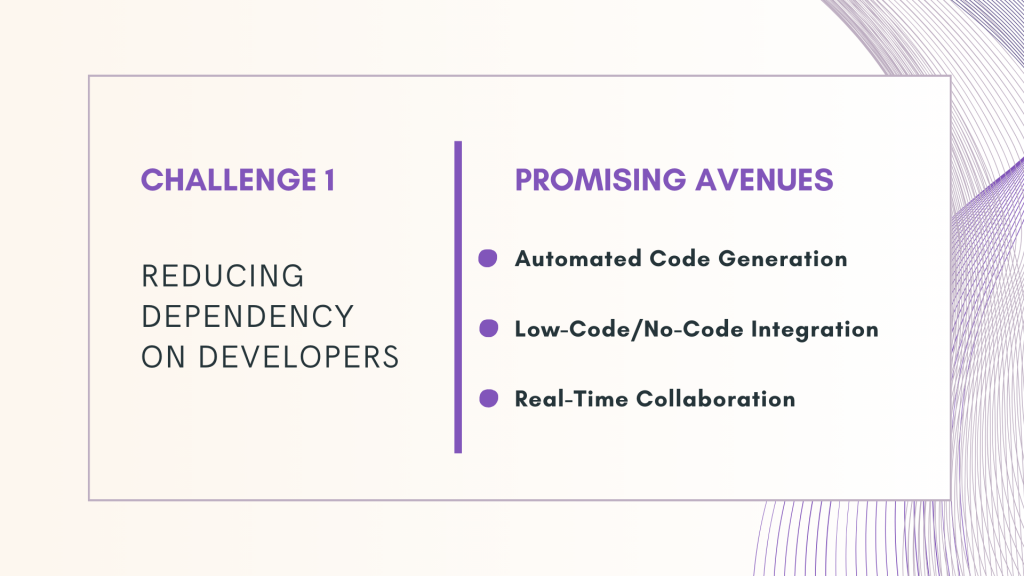
Automated code generation, low-code integration, and real-time collaboration will redefine the data visualization landscape. Let’s take a glimpse into what lies ahead with our projections for these promising avenues:
- Code Snippet Generator: Include a feature within the library that generates clean and well-documented code snippets based on user interactions.
- Copy-Paste Integration: This allows users to easily copy generated code and integrate it into their projects.
- User-Friendly Interface: Design an intuitive, user-friendly interface that minimizes the learning curve for users who may not be developers.
- Drag-and-Drop Customization: Implement a drag-and-drop functionality allowing users to easily customize and configure charts visually.
- Version Control: Implement version control features within the library for better collaboration among team members.
- Annotations and Comments: Provide tools for adding annotations and comments within the library to facilitate communication.
- GitHub, and Bitbucket integration within Fusioncharts. This facilitates version control and accelerates collaboration among development teams.
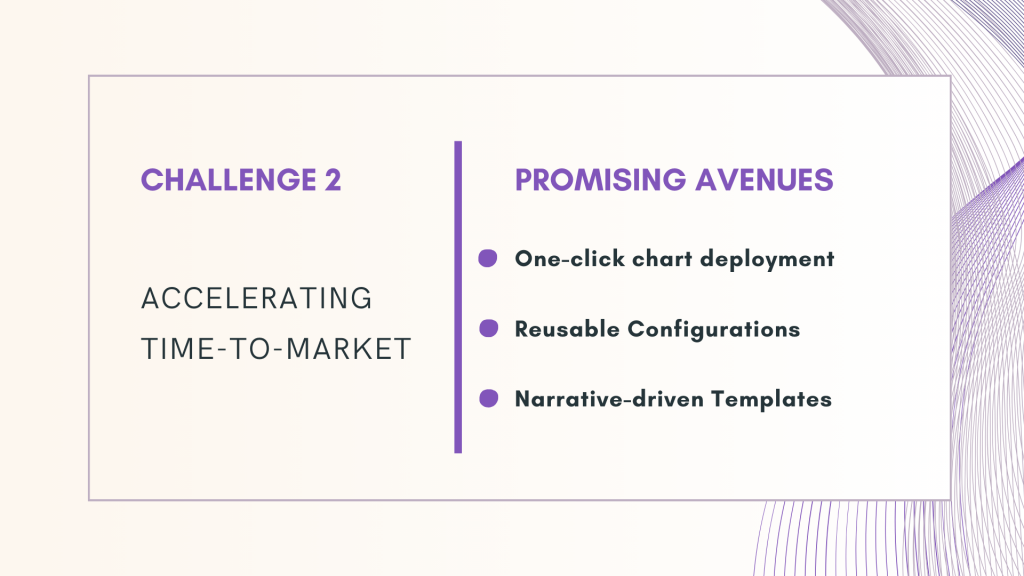
FusionCharts paves the way for accelerated time-to-market, introducing one-click chart deployment, reusable configurations, and narrative-driven templates. Let’s unfold the future possibilities for this trajectory:
- Framework Integrations: Integrate Fusioncharts seamlessly with popular web frameworks and content management systems.
- One-Click Deployment: Simplify the deployment process with one-click deployment options for common use cases.
- Save and reuse chart configurations: This not only speeds up development but also ensures consistency across different charts in a project.
- Code Snippet Library: Build a library of commonly used code snippets for specific chart configurations and interactions. Users can easily copy and paste these snippets, reducing the time spent on coding repetitive tasks.
- Local Template Repository: Offer a template repository within the library where users can access and share pre-designed chart templates.
- Export/Import Templates: Enable users to export and import templates directly within the library.
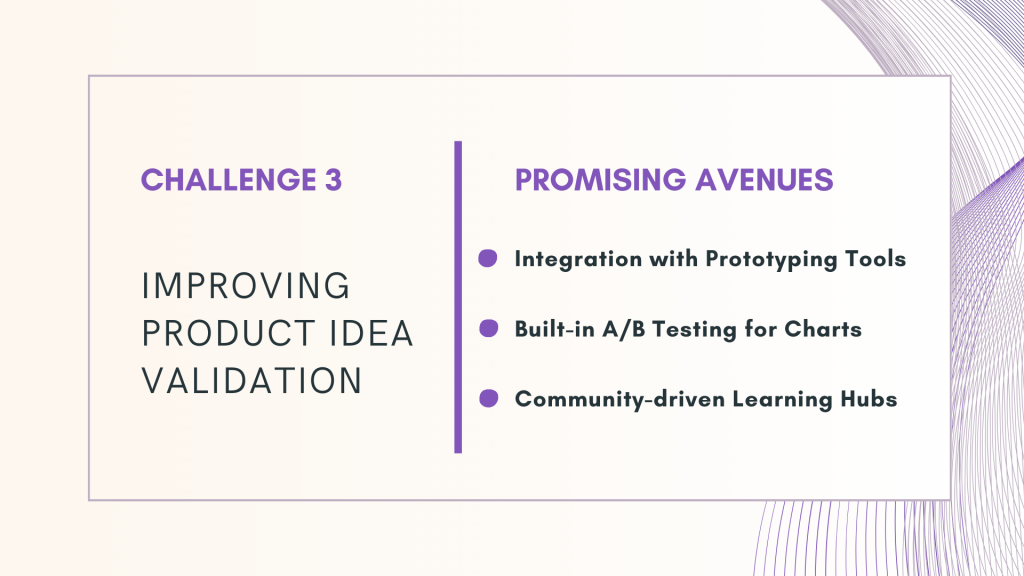
The journey towards innovation also involves improving product idea validation. Integration with prototyping tools, built-in A/B testing, and a community-driven learning hub create a robust ecosystem for creativity and refinement. FusionCharts not only acknowledges the importance of these features but also sets the stage for their seamless integration into the development process.
- Live Preview: Develop a live preview feature within Fusioncharts for users to instantly see how changes affect the appearance of their charts.
- Rapid Prototyping Tools: Create a dedicated section for rapid prototyping, enabling users to experiment with different chart configurations swiftly.
- Built-in A/B testing capabilities: allowing users to create multiple versions of a chart and test which performs better. This provides valuable insights for refining chart designs based on user preferences.
- Knowledge Hub: Establish a community-driven learning hub with tutorials, case studies, and best practices.
- User Showcases: Encourage users to share their innovative uses of Fusioncharts, creating a rich repository of real-world examples
Javascript chart libraries are a great resource for data visualization if you have a team of skilled developers and time to spare. But what if that is not the case?
Building data visualizations with your team can seem like the only path you can take. However, there is always a choice and you don’t have to resort to using Javascript chart libraries. Which path should you take? Let’s explore some innovative ideas:
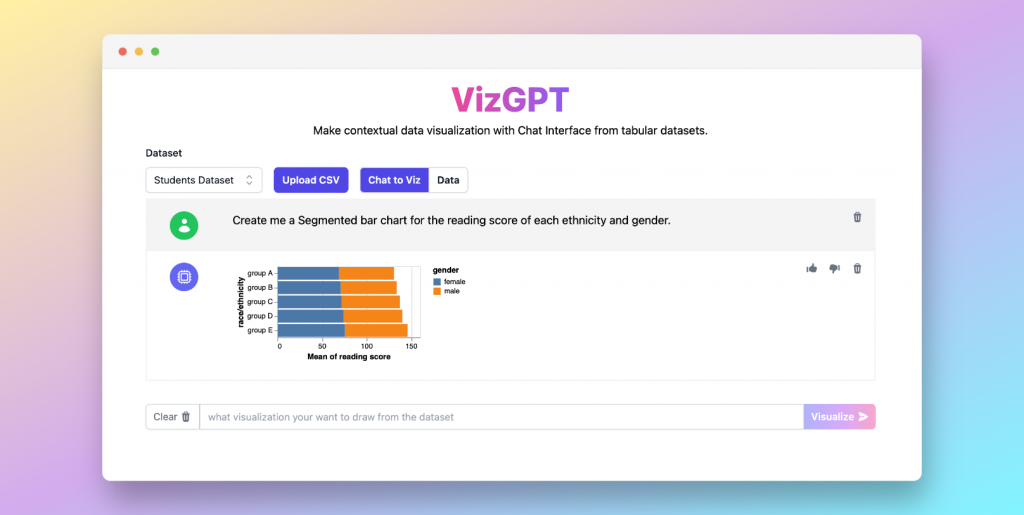
VizGPT is a powerful tool that leverages the capabilities of GPT models to create data visualizations. It interprets natural language queries and generates corresponding visualizations, making it easier for users to understand and analyze data.
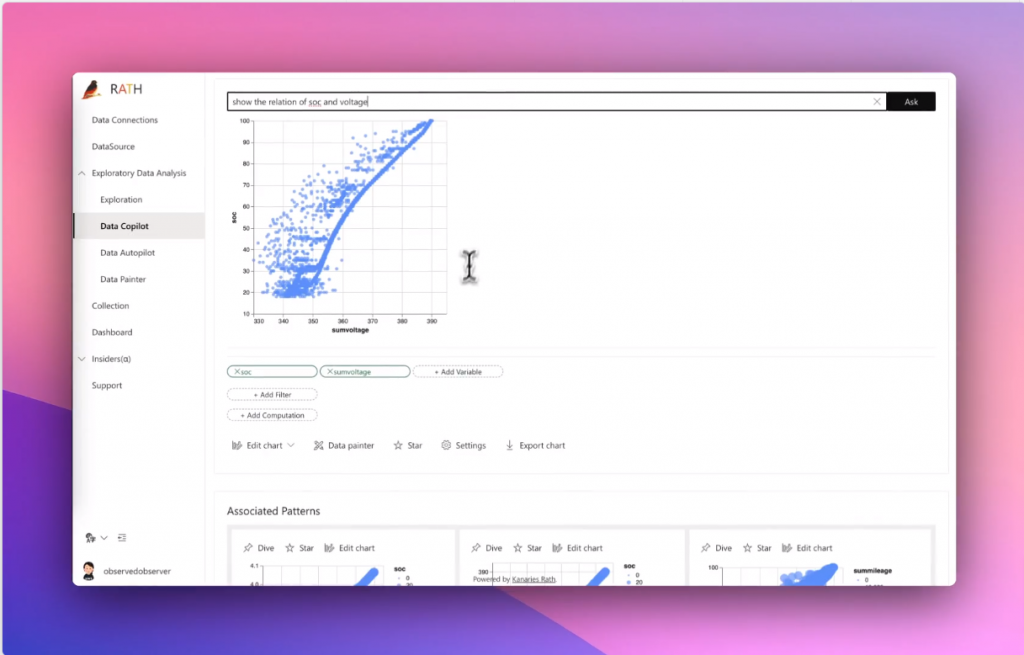
RATH integrates ChatGPT into your data analysis workflow, acting as your 24/7 personal data analyst, streamlining your workflow, and boosting your productivity.
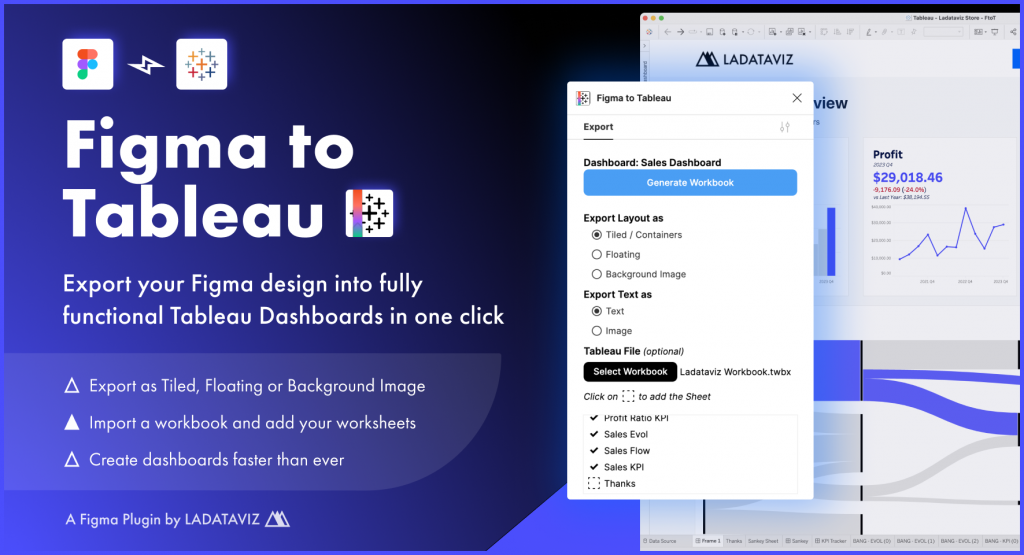
With one click, the plugin lets you turn your designs into fully functional Tableau Dashboards. You no longer have to rebuild your dashboard in Tableau and fight with containers or inconsistent floating elements.
Security and compliance are paramount considerations in the development and adoption of any software, including JavaScript charting libraries. Ensuring that these libraries meet high standards for data protection and adhere to relevant compliance regulations is crucial for maintaining user trust and safeguarding sensitive information.
FusionCharts recognizes that in an era where data protection and compliance are non-negotiable, JavaScript charting libraries should transcend their visual representation role to become bastions of security. This commitment ensures the safeguarding of sensitive information, fostering user trust and adherence to regulatory standards.
As we stand on the cusp of a new era, FusionCharts invites the software industry to not only adapt but thrive in the realm of AI-powered data visualization. The trends outlined for 2024 are not just predictions; they are a call to action. Embrace change, innovate relentlessly, and let FusionCharts be your guide in navigating the exciting landscape that lies ahead. Happy New Year, and here’s to a future where data visualization knows no bounds.