FusionCharts : Explore 100+ Charts and 2000+ Maps
FusionCharts provides over 100+ charts and 2000+ maps. With extensive documentation, a consistent API, and a range of customization options - FusionCharts is the most comprehensive JavaScript charting library that is loved by 750,000 developers across the globe. FusionCharts includes FusionCharts, FusionWidgets, PowerCharts , and FusionMaps.
All our charts are designed to work on JavaScript, React, Vue, Angular, jQuery, Ember, etc. Head to these charts to check out the code and visualization of each of these frameworks.
FusionCharts
With 50+ chart types, FusionCharts consists of the most commonly used charts like column, line, and pie for your reports and dashboards.
FusionWidgets
From Gauges and KPIs to funnel and pyramid charts, FusionWidgets makes your dashboards and monitors a lot more insightful.
PowerCharts
With the inclusion of heat & treemaps, radar, and statistical charts, PowerCharts is a set of advanced charting widgets for domain-specific usage.
FusionMaps
Plot your crucial business data like revenue by regions with over 2000 data-driven maps that are included in FusionMaps.
FusionCharts
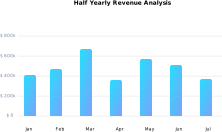
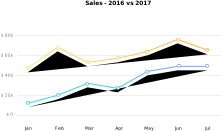
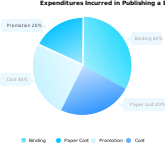
FusionCharts is our flagship product that consists of 50+ chart types like Line, Area, Column, Bar and more. A perfect addition to your reports, dashboards, surveys, monitors and analytics. Click on a chart to see it in action.


FusionWidgets
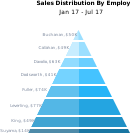
FusionWidgets makes your KPIs and real-time data in dashboards, monitors and reports more insightful with widgets like Gauge and Speedometer. Click on a chart type to see it in action.




PowerCharts
PowerCharts is a set of advanced charting widgets like Heatmaps, Radar or Node graphs for domain specific usage. Click on a chart type to see it in action.





FusionMaps
FusionMaps has over 2000+ geographical maps, including all countries, US states, and regions in Europe for plotting business data like revenue by regions, employment levels by state and office locations.


