With the exponential growth of data-driven applications and the increasing reliance on JavaScript charting libraries for data visualization, the need to prioritize security has never been more critical. Consider this: according to a recent study by Verizon, data breaches have surged by 67% over the past five years, costing businesses millions in damages and tarnishing reputations in the process.
In 2023 alone, over 5.1 billion records were compromised in data breaches worldwide, highlighting the alarming vulnerability of sensitive information in today’s digital landscape.
In this blog post, we’ll delve into the vital topic of implementing security protocols to safeguard data presented by JavaScript charting libraries. As organizations strive to deliver compelling visualizations to stakeholders and customers, they often overlook the inherent security risks associated with data visualization applications.
The purpose of this discussion is twofold: first, to shed light on the potential risks posed by vulnerabilities in charting libraries, and second, to provide actionable insights and best practices for mitigating these risks. By understanding the significance of addressing security concerns in data visualization applications, businesses can proactively safeguard their data and uphold the trust of their users and stakeholders.
Table of Contents
Understanding Security Risks in JavaScript Charting Libraries
JavaScript charting libraries have revolutionized the way data is presented and analyzed in web applications, offering a wide range of features and functionalities for creating interactive and visually appealing charts. Some popular libraries in this domain include FusionCharts, Highcharts, and Chart.js, each with its own set of capabilities and user base.
These libraries provide developers with a convenient way to incorporate dynamic charts and graphs into their web applications, enabling users to gain insights from complex datasets with ease. FusionCharts, for instance, offers a comprehensive suite of chart types and customization options, while Highcharts is known for its simplicity and flexibility. Similarly, Chart.js is favored for its lightweight footprint and ease of use, making it ideal for smaller projects. To further secure data visualizations especially when accessing dashboards remotely, developers and analysts often rely on private, encrypted connections. Learning how to configure VPN on Mac not only protects network traffic but also ensures safer access to internal charting environments.
Common security risks:
Despite their popularity and utility, JavaScript charting libraries are not immune to security vulnerabilities. Some of the common risks associated with these libraries include:
Impact of security breaches:
The consequences of security vulnerabilities in JavaScript charting libraries can be severe, both for businesses and their users. Data breaches resulting from vulnerabilities in charting libraries can lead to
Data Exposure: Inadequate data handling practices or insecure APIs can lead to unintended exposure of sensitive information.
Loss of trust: Malicious users may exploit vulnerabilities in input validation and data processing to execute SQL injection or XSS attacks.
Regulatory compliance issues: Lack of proper CSRF protection mechanisms can enable attackers to manipulate user sessions and perform unauthorized actions on behalf of legitimate users.
Best Practices for Securing Data in JavaScript Charting Libraries
In this section, we’ll explore a comprehensive set of best practices and protocols aimed at mitigating security risks and safeguarding data presented by JavaScript charting libraries.
Data Encryption:
Encrypting sensitive data before rendering it with charting libraries is paramount to ensuring its confidentiality and integrity. By utilizing robust encryption algorithms and secure key management practices, organizations can prevent unauthorized access and protect sensitive information from interception or tampering.
Authentication and Authorization:
Implementing robust authentication mechanisms and proper authorization checks is essential for controlling access to data presented by charting libraries. By requiring users to authenticate themselves and verify their identity, organizations can prevent unauthorized access and ensure that only authorized users have access to sensitive data.
Secure Communication:
Utilizing HTTPS to encrypt data transmission between the server and client is critical for protecting data presented by charting libraries from interception or tampering. By encrypting data in transit, organizations can prevent eavesdropping and ensure the confidentiality and integrity of sensitive information.
Content Security Policy (CSP):
Implementing Content Security Policy (CSP) headers can mitigate risks associated with XSS attacks by controlling resource loading and preventing the execution of malicious scripts injected into web pages. By specifying trusted sources for scripts, stylesheets, and other resources, organizations can reduce the likelihood of XSS vulnerabilities in charting libraries.
Cross-Origin Resource Sharing (CORS):
Configuring Cross-Origin Resource Sharing (CORS) policies is essential for controlling access to resources served by charting libraries from different origins. By specifying which domains are allowed to access resources, organizations can prevent unauthorized access and mitigate the risk of cross-origin attacks.
Input Validation and Sanitization:
Validating and sanitizing user inputs is crucial for preventing injection attacks such as SQL injection, XSS, and CSRF. By validating input data against predefined criteria and sanitizing it to remove potentially malicious content, organizations can mitigate the risk of injection vulnerabilities in charting libraries.
Client-Side Security Measures:
Implementing client-side security measures, such as sandboxing and secure coding practices, is essential for enhancing security within the browser environment. By isolating charting libraries from potentially malicious scripts and adhering to secure coding guidelines, organizations can reduce the risk of client-side vulnerabilities and attacks. Pairing strong security practices with best antivirus software reduces device risks and strengthens protection.
Regular Security Audits and Updates:
Conducting regular security audits and applying updates is critical for identifying and mitigating known vulnerabilities in charting libraries. By staying informed about security patches and updates released by library maintainers, organizations can proactively address security issues and ensure the ongoing security of data presented by charting libraries.
By following these best practices and protocols, organizations can effectively mitigate security risks and safeguard data presented by JavaScript charting libraries against potential threats.
Implementation Tips and Examples
When implementing security protocols in JavaScript charting libraries, it’s essential to follow best practices and guidelines to ensure robust protection against potential threats. Here are some practical tips for developers:
Practical Implementation Tips:
- Always use the latest version of the charting library, as newer versions often include security patches and updates.
- Enable security features such as data encryption, authentication, and authorization mechanisms offered by the charting library.
- Implement input validation and sanitization to prevent injection attacks and mitigate XSS vulnerabilities.
- Utilize secure communication protocols such as HTTPS to encrypt data transmission between the server and client.
- Regularly review and update security configurations to address emerging threats and vulnerabilities.
- Educate developers on secure coding practices and provide training on how to identify and mitigate security risks.
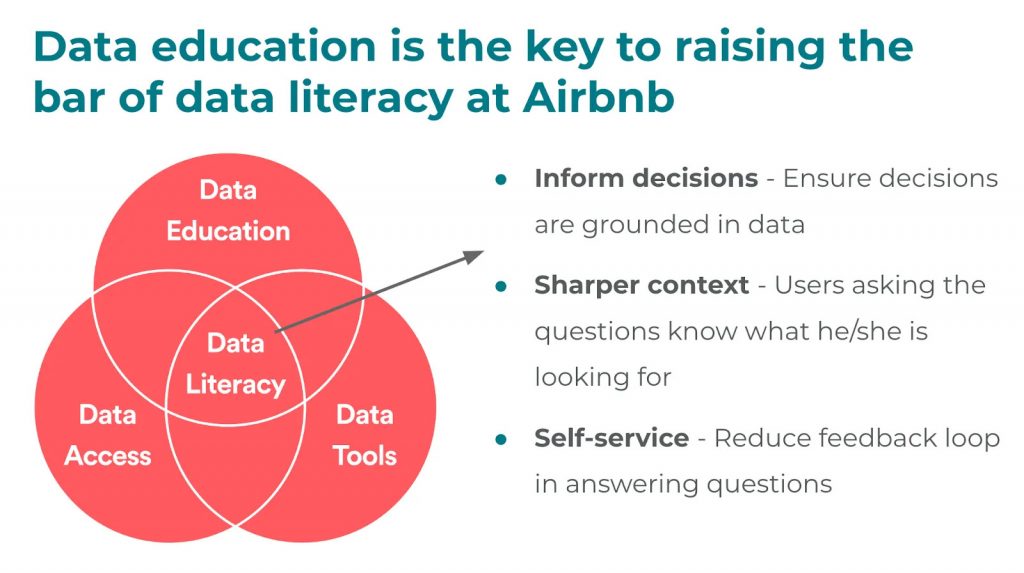
Real-world example: How Airbnb harnessed data literacy to drive data-driven decision-making
Data literacy is a fundamental pillar of effective data governance, enabling individuals to comprehend, interpret, generate, and convey data.
Failure to grasp the intricacies of data can lead organizations to relinquish control over its lifecycle. Conversely, when individuals possess fluency in data generation, utilization, and application, teams can make decisions informed by data.
Moreover, data literacy fosters responsible data usage, a critical aspect of any successful data governance initiative.
(Source: https://atlan.com/data-governance-examples/)
How did Airbnb foster data literacy?
In a proactive move towards enhancing data literacy, Airbnb introduced an internal educational endeavor dubbed “Data University.”
This initiative aims to elevate data literacy across all organizational departments, empowering staff to adeptly understand, interpret, and leverage data within their respective roles.
The efficacy of this program is evidenced by the fact that 45% of Airbnb employees now engage with their internal data platform on a weekly basis.
Consequently, Airbnb has been able to democratize data access and streamline decision-making processes, all while ensuring responsible data usage.
Closing Thoughts
In today’s interconnected digital landscape, data security is paramount. By implementing robust security protocols in JavaScript charting libraries, we not only protect sensitive information but also uphold the integrity and trustworthiness of our applications. Let’s work together to build a safer and more secure web for all users.
In this blog post, we’ve explored the critical importance of implementing security protocols in JavaScript charting libraries to safeguard sensitive data presented in data visualization applications. Throughout our discussion, we’ve highlighted the various security risks associated with these libraries and provided actionable insights into mitigating these risks effectively.
Thank you for joining us on this journey to enhance data security in web applications. Together, we can make a significant impact in safeguarding sensitive data and protecting against potential security threats.
Additional Resources
Read → 5 Data Governance Examples: Case Studies from Airbnb, Uber, and More
Read → FusionCharts Security Statement
h2{
color: purple;
}
h5{
color: #6957da;
}