Introduction
FusionCharts provides over 100+ charts and +2000 maps with extensive documentation available for data visualization. However, it can be challenging to create effective and visually appealing charts without the right knowledge and expertise. Interestingly, ChatGPT does a great job turning raw data into visually appealing charts.
In this article, we will explore the powerful synergy between ChatGPT and FusionCharts, two cutting-edge tools that are transforming the way we interact with data and create data visualizations.
Here are 5 simple steps for creating your first chart in FusionCharts with ChatGPT. Let’s dive in!
Step 1: Create a basic table
Let’s start with an example. For the following demonstration, we will be working with the top five cities in terms of tourist arrivals
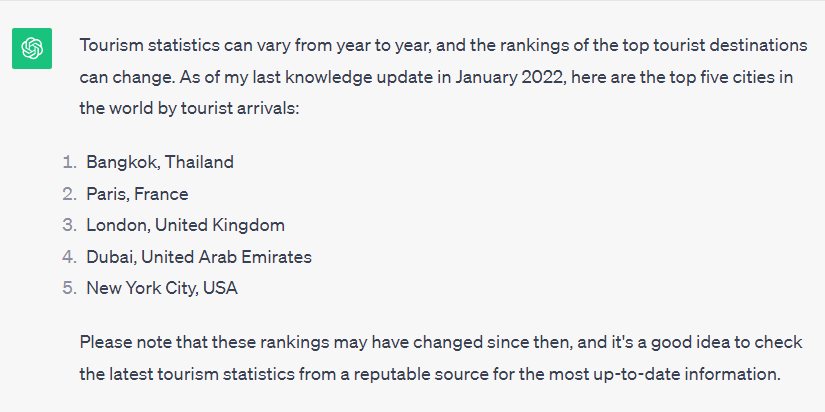
I asked this of ChatGPT’s free version and here’s what I got back:
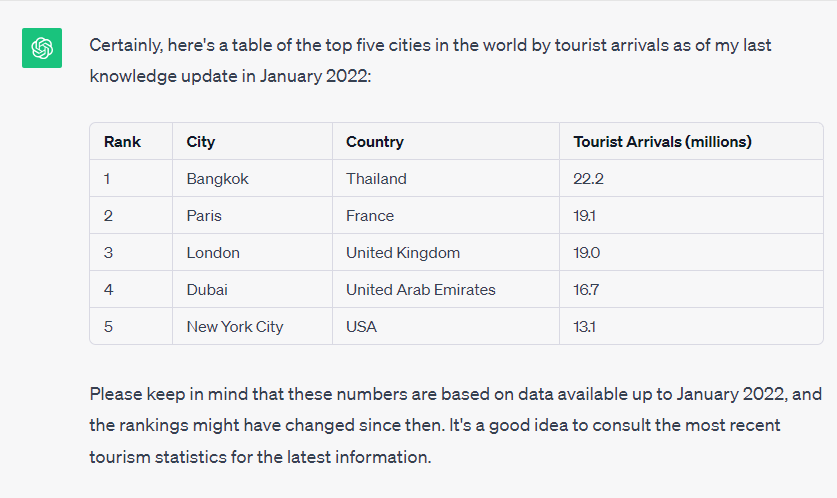
Turning it into a table is simple. Here’s how I tell ChatGPT I want a table:
Step 2: Let chatGPT choose the right chart type
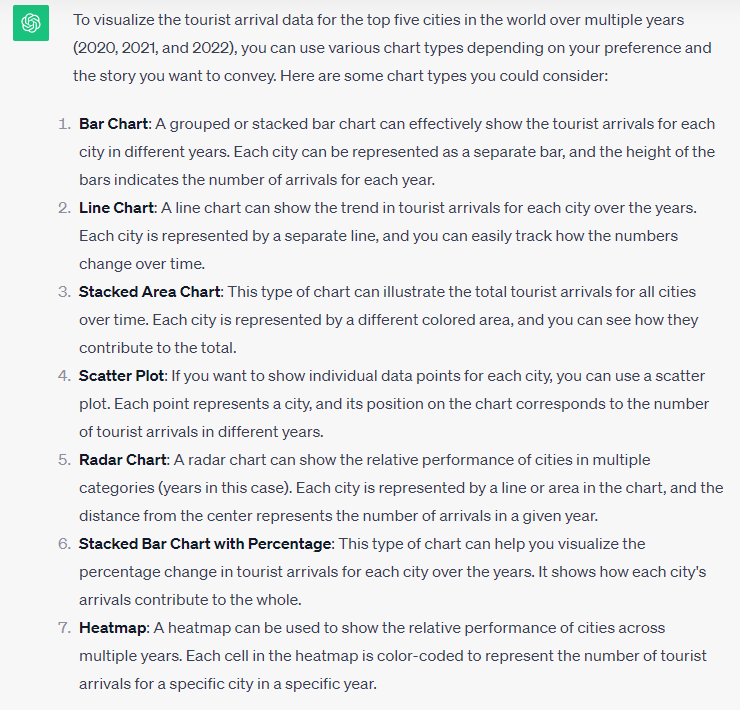
Have you ever worked with complex datasets containing hundreds of columns? Then you’ll know the pain of deciding which data to visualize. With so many charting options, it can be overwhelming to decide which one makes sense.
Below is an example of a prompt you could use.
Here’s an example of the output you could receive:
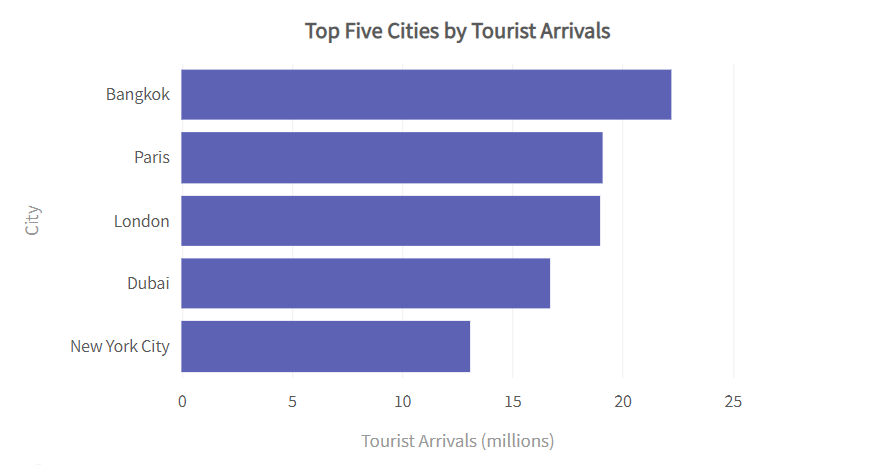
Step 3: Create a simple bar chart using FusionCharts
ChatGPT with Advanced Data Analytics enabled can make line charts, bar charts, histograms, pie charts, scatter plots, heatmaps, box plots, area charts, bubble charts, Gantt charts, Pareto charts, network diagrams, Sankey diagrams, choropleth maps, radar charts, word clouds, treemaps, and 3D charts.
In this example, we’re just going to make a simple bar chart.
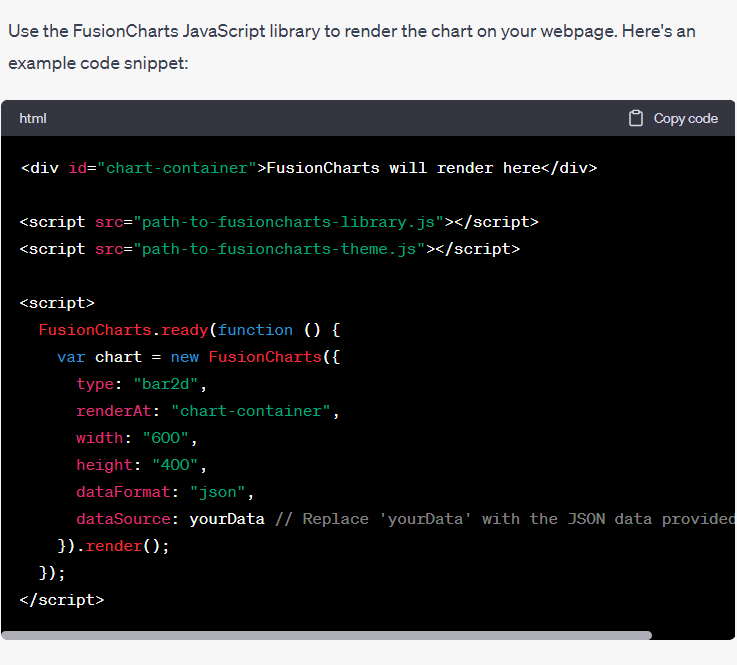
By using a demo code viewer, you can see how the chart looks like
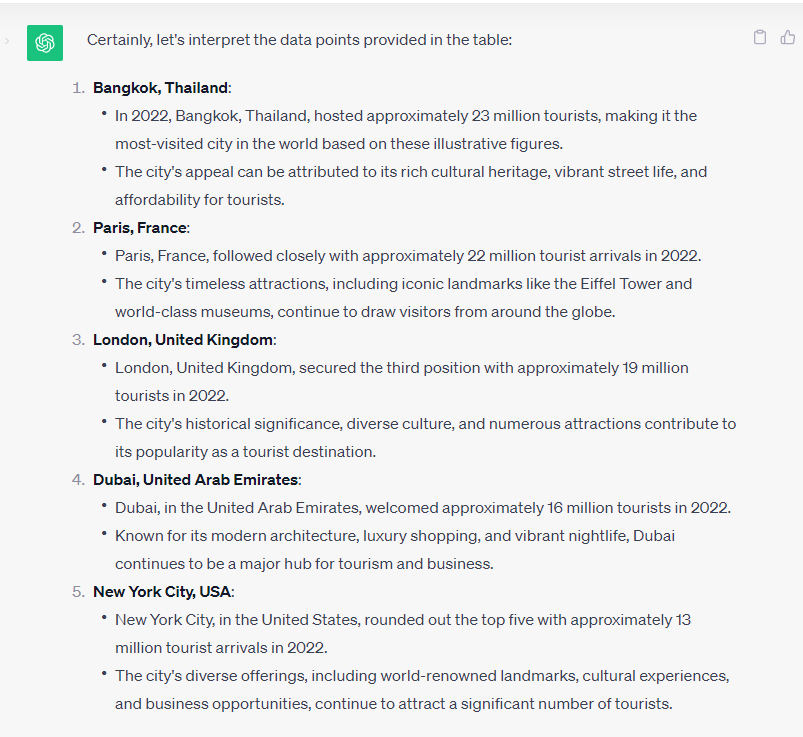
Step 4: Request an Interpretation of your chart
Unsurprisingly, you can also ask ChatGPT to interpret key insights from the chart. This is interesting, right?
That’s about as far as the free version will take us. From now on, we’re switching to the $20/month ChatGPT Plus version.
Step 5: Export your chart
Many people want to include charts and graphs in their work but give up when they find it too difficult to create. To export a FusionCharts chart as a JPG file, you can use FusionCharts’ built-in export feature.
Or if you already have access to ChatGPT Plus version, you can simply export your chart with a prompt like this:
And there you have it. Your chart is ready!

Conclusion
ChatGPT’s natural language processing capabilities enable users to interact with data in a conversational manner, allowing even those without a technical background to engage meaningfully with their data.
FusionCharts, on the other hand, excels in creating visually stunning, interactive, and informative charts and dashboards. By harnessing the complementary strengths of ChatGPT and FusionCharts, businesses can chart their course toward better-informed decisions and enhanced data-driven success.
Moreover, this integration is future-proof. As both ChatGPT and FusionCharts continue to evolve, users can expect even more sophisticated features and capabilities. This will undoubtedly contribute to more efficient and insightful data-driven strategies in the years to come.
Elevate your data visualization skills today with FusionCharts and ChatGPT!
.blog_prompt{
padding: 10px 8px;
background: #f3f3f3;
border-left: 4px solid green;
}