As a product manager or a developer, you’re well aware that embedded JS charting components can transform Web applications with powerful new user experience (UX) capabilities. Specialized, commercial packages, such as FusionCharts that work in any framework deliver stunning visualizations and are relatively easy to integrate and maintain. The range of charts and maps available provides developers and product managers with many choices that power thousands of applications today.
However, the explosion of business intelligence (BI) and analytics tools have advanced customer expectations. Simple charting is not always enough for sophisticated reporting and analytics use cases.
Customers are demanding more interactivity and better integration of data. Achieving this with charting tools is not only expensive but sometimes impossible within typical Web applications
Embedded BI tools aim to solve this problem by providing a modular approach to integrating analytics into Web applications. Tools, such as Yellowfin BI, allow creating analytics and reporting modules for any Web application. The resulting embedded analytics UX can be seamless, yet development, time to market, and maintenance are drastically reduced. Years of code and IP become part of applications in months and customers receive an outstanding value that can be immediately monetized. JS visualizations and customizations can be applied on top of Yellowfin to create a highly unique UX, if that is something that your customers require.
Why would one choose Yellowfin for their embedded BI and analytics application?
Three compelling reasons justify high ROI from embedding analytics in your application:
- New business capabilities – new features deliver value for customers that can be monetized and used to differentiate from competitors
- Faster time-to-market – reduced time and effort to deliver new capabilities
- Full control over cost – lower development and maintenance costs with clear visibility to manage for the future
Deliver new business capabilities
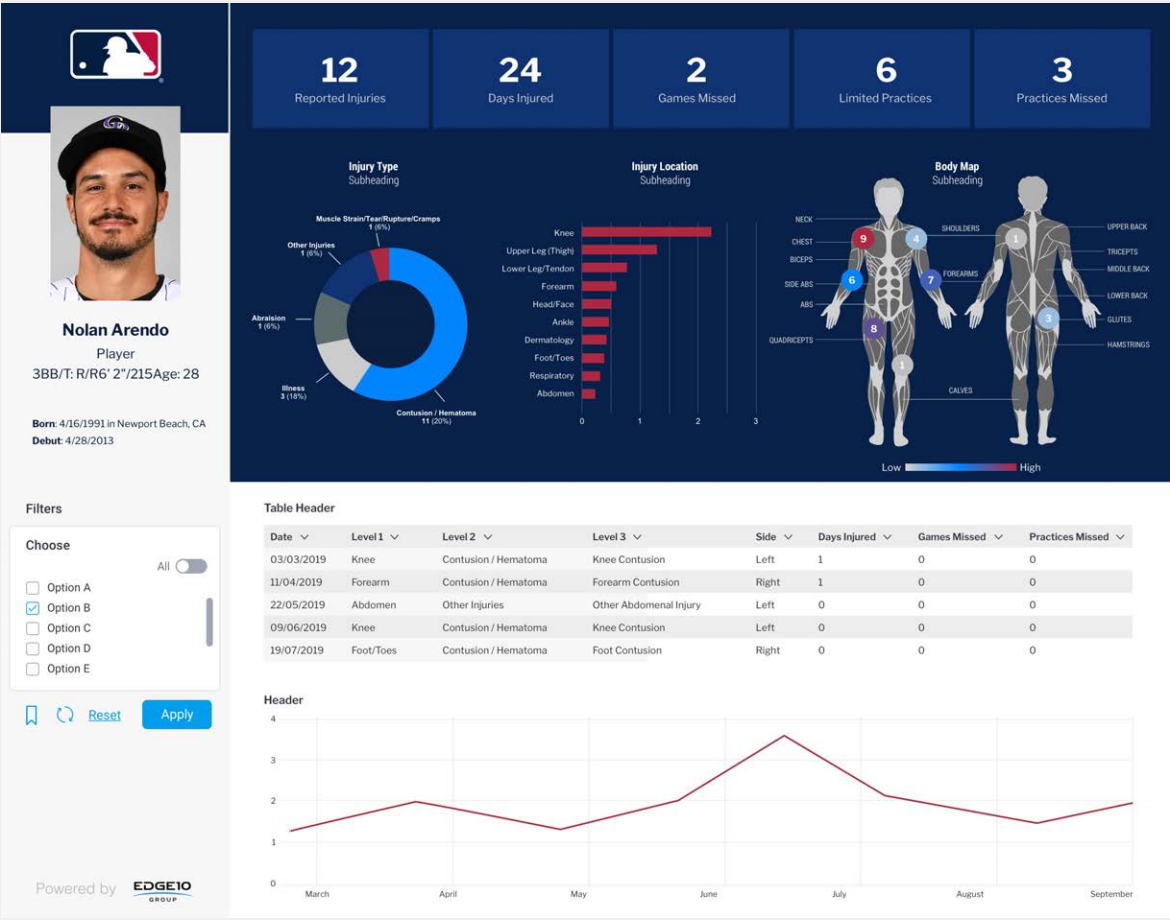
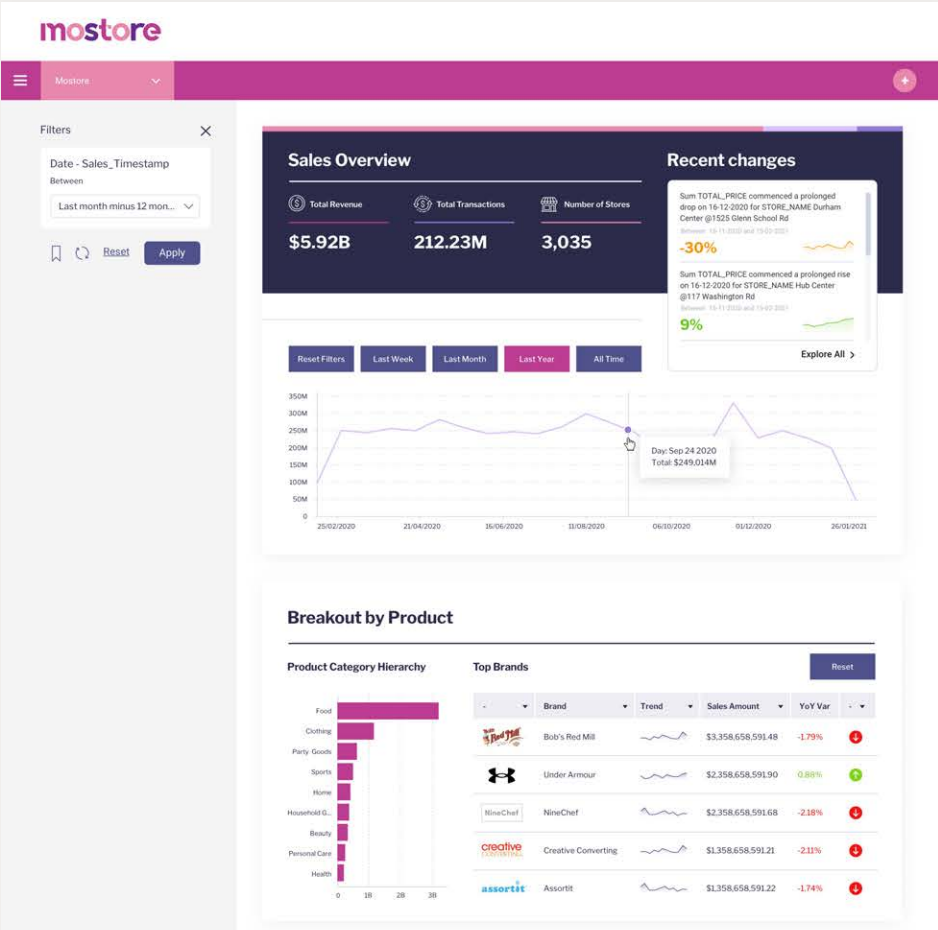
The reality is simple charts are not enough. They are “flat” with limited drill-down capabilities and linking them together presents a lot of limitations. BI and analytics dashboard solutions go way beyond what is possible with traditional charts. Yellowfin data visualizations are tightly integrated with many easy-to-use filtering and customization options. Users can drill down at multiple levels and data stays consistent.
Yellowfin comes with a configurable reporting module that not only can produce reports, but allows multiple scheduling and distribution options. Data throughout the application is easily reusable for any Yellowfin component.
Yellowfin additionally delivers multiple innovative advanced capabilities that enhance traditional embedded dashboarding and reporting. Its Natural Language Query (NLQ) capability, Guided NLQ, allows users to develop ad-hoc reports with easily understandable English language-based syntax. These can be distributed with Stories, which is a proprietary collaboration analytics data storytelling module. Yellowfin’s Signals is AI-based alerting is also available to automate decision-making using automated business monitoring. As a package, Yellowfin’s innovation is also recognized by industry analysts (as a Visionary in Gartner’s Analytics and Business Intelligence Magic Quadrant for several years in a row).
Importantly, Yellowfin allows for tightly managed security and compliance that is increasingly important. The ability to provide wide and easy access to information, yet enable all necessary controls and audit capabilities makes Yellowfin ideal for many verticals, such as healthcare and financial services.
Faster time to market
While tools like FusionCharts make dashboard development relatively easy and fast, the back-end and coding required to deliver reporting for robust Web applications can be significant and costly. With a pre-built BI and analytics tool, the work shifts from developers to business users. The added benefit is that users can continuously enhance functionality without lengthy development cycles. Implementing embedded analytics reduces silos and increases focus on fast business results.
The alternative to building your own version of Yellowfin in any one Web application would require years and significant IP. Yellowfin can be configured in weeks and the application can be in front of your users in months. Given how many options exist to customize the Yellowfin UX, customers can have a completely seamless experience or a new one, depending on their needs, and you can still deliver the product in a fraction of the time.
Developers love Yellowfin because it is highly customizable. It is a big product but modular, so product managers and developers can pick and choose, what to implement when, and how. Yellowfin is committed to developers and continues to enhance the developer experience with more examples and developer-friendly tooling. Yellowfin is ideal for agile development cycles that bring together business and technical users.
Full Control Over Cost
Reduced time to market translates into lower costs, but more importantly high predictability of costs. Most product development projects are over budget and require rework. There is friction between business users and technical developers, as requirements frequently develop over a long period of usage, and yet technical resourcing is usually project-based.
What’s the difference? Customers estimate that embedded analytics solutions compared to custom builds cost 5x lower over the first few years of integration. That benefit excludes the additional revenue and competitive advantage that such solutions can deliver.
Of course, embedded analytics change resourcing where pure technical development is augmented by more “business” configuration. This requires a balanced shift of resources that is more beneficial long-term, as end-users and technical resources work closer together.
Resources are also more leveled, reducing the upfront concentration of resources that frequently create challenges for ongoing updates and maintenance.
Yellowfin is unique in its openness for revenue share models that further reduce upfront costs and align interests with customers’ goals and objectives.
A Few Examples of Embedded Solutions
Yellowfin has many successful healthcare case studies that illustrate deep contextual integration into applications that are used by thousands of end-customers, such as its work with the NHS Foundation. Solutions require scalability and performance that demonstrate the power of Yellowfin BI.
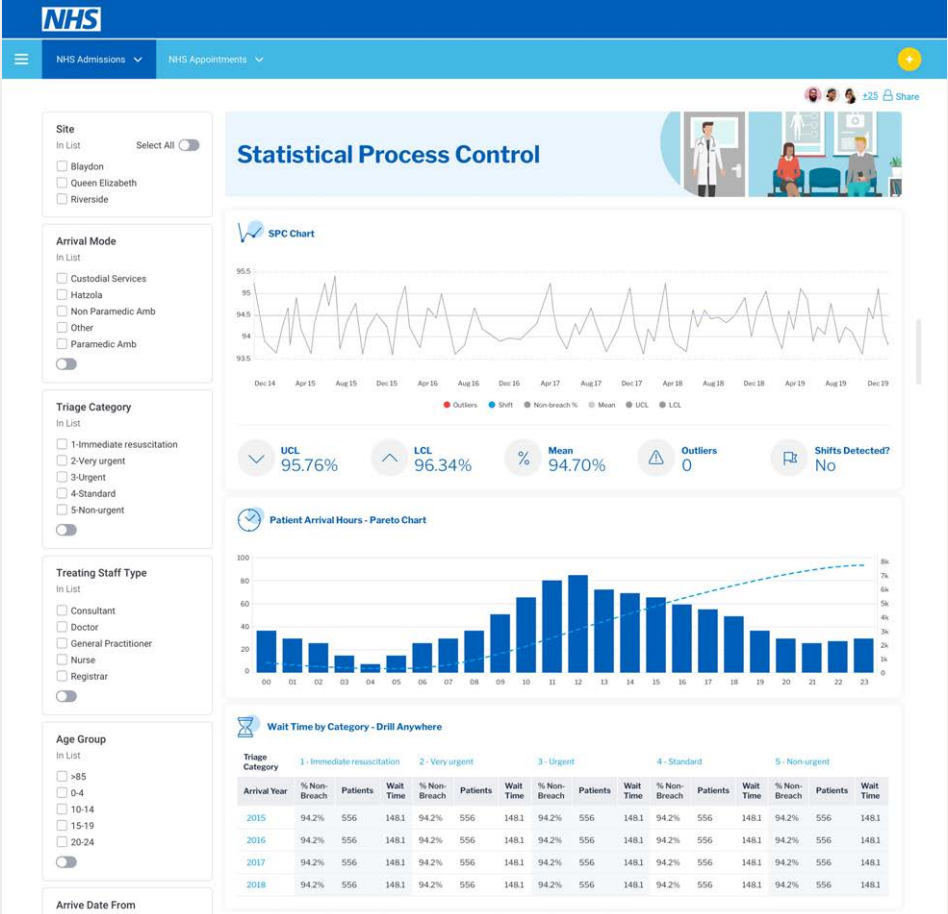
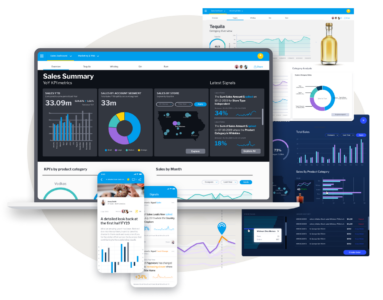
Visualizations can be highly impactful and include custom JS components.
Yellowfin has a number of pre-built templates for functions, such as its CRM, that can further accelerate implementation.
Accelerate the development of analytical applications with Yellowfin.
Provide rapid value to your enterprise customers with turn-key analytical applications that drive action and deliver insights as a fully managed service. Connect with our team to learn more.
<!–
Integrate analytics into your platform today
Assemble, extend, and embed dashboards and white-label analytics into your software with our developer toolkits, APIs and built-in code editing. Deploy at scale, and deliver exceptional analytical experiences with minimal effort.
Request Free Demo: https://www.yellowfinbi.com/campaign/live-demo
OR
Learn More https://www.yellowfinbi.com/solutions/software-developers–>